The Setup: Capex Without Applause
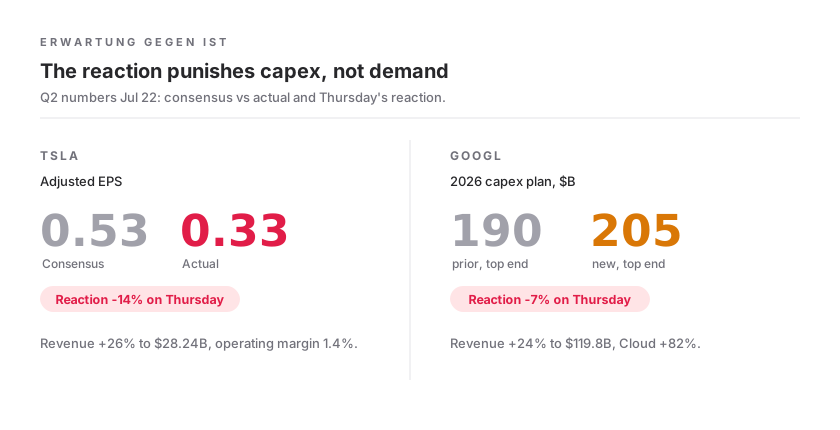
Alphabet and Tesla both posted record numbers, and both were sold for it. Alphabet grew revenue 24% to $119.8 billion with Cloud up 82%. Tesla posted its highest quarterly revenue ever at $28.24 billion. On Thursday Tesla still lost 14% and Alphabet 7%, the Nasdaq fell 2.15% to 25,137.69 and the S&P 500 1.21% to 7,408.30. In both cases the decisive part was the spending side. Alphabet lifted its 2026 capex range from $180-190 billion to $195-205 billion. At Tesla, spending rose 142% and pushed free cash flow negative.
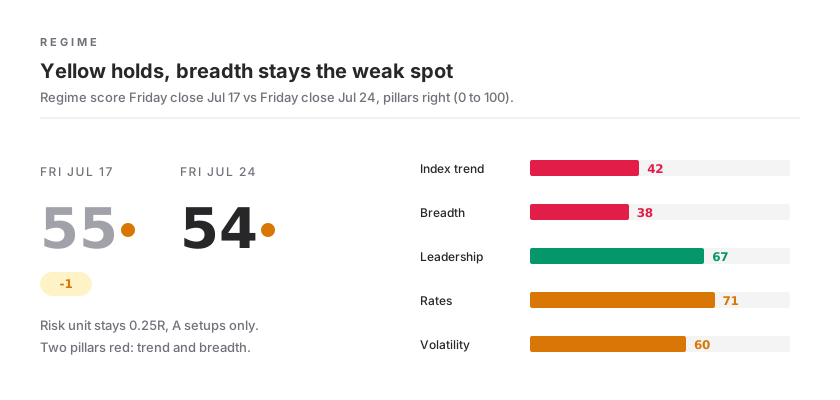
The regime score still slips only from 55 to 54, because the rotation absorbs the damage inside the index. Semiconductors were the epicenter of last week's correction and now sit back at rank 2 in the group standings, carried by a memory rally with Micron up 12% in a single session. Energy climbs from rank 21 to 12 with Brent above $94. Leadership has not broken down, it sits with different groups than it did two weeks ago.
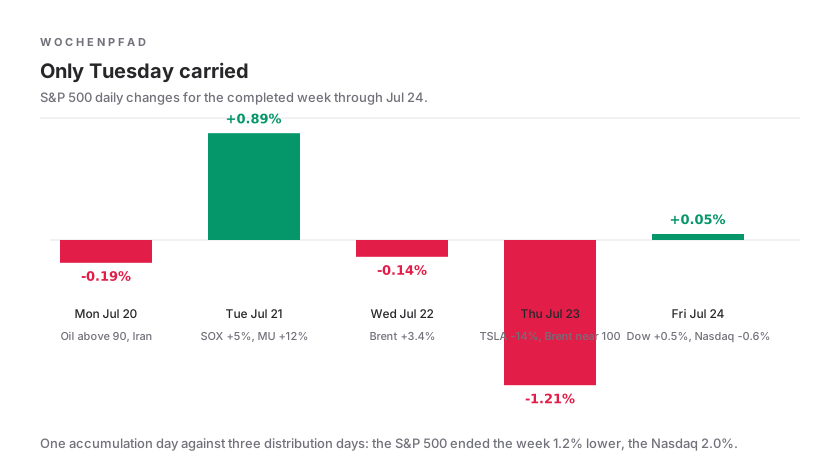
Breadth remains the weak spot. Only Tuesday delivered a genuine accumulation day, with 473 gainers above 4% against 132 losers. Wednesday and Thursday answered with distribution, and Friday closed negative again at 316 versus 505. What remains is a second losing week in a row. The S&P 500 closes at 7,411.98, down 1.2% on the week, the Nasdaq at 24,975.82, down 2.0%, while the Dow held up best at 51,947.25 and still gained 235 points on Friday. At the same time Brent tested $100 for the first time since May, after Houthi strikes hit two Saudi tankers in the Bab el-Mandeb. That made energy the only group being bought against the tape. Anyone building positions now does so against a majority of falling stocks and should size accordingly. The risk unit stays at 0.25R, and cash counts as a position.
From the Desk: A Week Where Watching Was the Work
I traded very little this week. That sounds like a weak weekly report, but it is exactly what the regime score prescribes. At yellow, with breadth deep in the red, the risk unit is 0.25R, and clean setups were rare anyway. Anyone who still goes fully invested in a week with two distribution days, a Fed meeting on the horizon and four mega-cap reports in the pipeline is trading their impatience, not their plan.
What I did instead was cut the watchlist down. Two names stay at the top of mine, and both come from the corner of the market that stayed green on Friday. AMD holds RS 98 and three-month momentum of 74%, sits almost exactly on its 20-day line and trades about 10% below its high. At $16.1 billion in daily dollar volume it is the most liquid name in the entire screen. That is institutional money moving, not a single opinion. DELL stands stronger still at RS 99 and 108% over three months, but at 5.4% above its 20-day line it is stretched and needs a base before I would touch it.
My expectation for the coming weeks, and this is explicitly an expectation and not a recommendation: if this market turns, these two will be among the names that lead it. Both sit on the receiving side of the investment cycle, both have the balance sheet to absorb a dent, and neither was among the first to be sold on Friday's hard day. What keeps me out is not the stock, it is the calendar. First the Fed meeting, then the four reports, and after that I look at the structure in the chart.
The mistake I catch myself making most often in phases like this is the early position. You see the strength, you want to be involved, and you buy the third stretched candle instead of the first tight base. That is why both names only have alerts sitting where the structure would be right. There is no buy limit in the market.
| Symbol | RS | Vom Hoch | Beobachtung | Momentum 3M | Dollarvolumen | Zur 20T Linie |
|---|---|---|---|---|---|---|
| AMD | 98 | -9.9% | At the 20-day line, base still open | +74% | $16.1B | -0.9% |
| DELL | 99 | -5.8% | Stretched, needs consolidation | +108% | $4.2B | +5.4% |
- RS
- 98
- Vom Hoch
- -9.9%
- Beobachtung
- At the 20-day line, base still open
- Momentum 3M
- +74%
- Dollarvolumen
- $16.1B
- Zur 20T Linie
- -0.9%
- RS
- 99
- Vom Hoch
- -5.8%
- Beobachtung
- Stretched, needs consolidation
- Momentum 3M
- +108%
- Dollarvolumen
- $4.2B
- Zur 20T Linie
- +5.4%
Regime: Yellow Holds on Red Pillars
The regime score closes the week at 54, after 55 last Friday. On Thursday itself the daily reading dropped to 35 and into red, and Friday pulled it back. Underneath, the tension remains. The trend pillar sits at 42 with none of the three core indexes in a bullish short-term trend, breadth sits in the red at 38, and only 48.6% of stocks hold above their 50-day line. Yellow is carried by leadership alone at 67. Some 1,200 stocks show strong momentum, led by biotechnology, semiconductors and refiners. Thursday scratched that leadership, it did not break it.
This is a selective market. Orienting yourself by the index gives no reliable picture, what matters is the group a stock sits in. The read invalidates to the downside if leadership cracks, meaning the pillar drops below 60 or the leading groups give up their ranks. To the upside, only a reclaim of the 50-day line in QQQ and the S&P 500 lifts the trend pillar out of the red.
The Index Picture: Four Days, One Pattern
The week can be read off four days. On Monday the oil spike pressed the S&P 500 down 0.19% to 7,443.28 while semiconductors were already stabilizing. On Tuesday the memory rally carried all three indexes higher, the Nasdaq gained 1.29% to 25,837.21 and ended a three-day losing streak. On Wednesday trading held back ahead of Alphabet and Tesla, the S&P 500 easing 0.14%. On Thursday the reaction arrived, with minus 1.21% to 7,408.30 on the S&P 500, minus 2.15% to 25,137.69 on the Nasdaq and a 507-point loss to 51,711.65 on the Dow.
More important than the size of the setback is where it sits in the trend picture. None of the three core indexes trades in a bullish short-term trend, yet all three still carry a positive three-month balance between 6 and 10%. As long as the leading groups hold their ranks, this is a correction within an uptrend and not the start of a bear market. Friday did not continue the distribution, but it did not deliver a stabilization either. The Dow gained 235.60 points to 51,947.25, the Nasdaq lost a further 161.87 points to 24,975.82, and the S&P 500 closed all but unchanged, up 3.68 points at 7,411.98. Position size therefore stays small.
The Events That Shaped the Week
Four themes shaped the week. Alphabet and Tesla shifted the debate from demand to capital discipline with their reports and cost the Nasdaq 2.15% on Thursday. The memory rally around Micron and Sandisk answered last week's supply question bullishly at first, before Friday took much of it back. In oil, the US-Iran conflict widened to the tanker front, and after Houthi attacks in the Bab el-Mandeb, Brent tested $100 for the first time since May. Outside the mega caps, meanwhile, the reporting season runs better than feared, with nearly 88% of early S&P 500 reports beating earnings estimates.
What Changed The Weekly Plan
Alphabet Q2
Tesla Q2
Memory rally
Meta cloud report
SK Hynix shock
Oil tests $100
Earnings Calendar: What Happened, What Comes
The table lists what each company reported and how the stock responded to it. This week the deciding factor was not whether someone beat estimates, but what they said about their spending. Next week the risk sits on two evenings. Microsoft and Meta report Wednesday, straight after the Fed decision, and Apple and Amazon follow on Thursday. Four mega caps in 30 hours, and all four face the same question: are higher spending plans still read as strength, or by now as a cost risk?
What Changed The Weekly Plan
Super Micro
3M
General Motors
AT&T
Intel Q2
Microsoft Q4, Meta Q2
Apple Q3, Amazon Q2
Vermilion Energy
Reporting Season Scorecard: Uneven Reactions
Nearly 88% of the first roughly 66 S&P 500 reports beat earnings estimates. The season still does not feel that way, because the price reactions are so uneven. Misses get punished hard, while good numbers earn little. Tesla lost 14% after its EPS miss, Alphabet 7% after strong numbers with expensive guidance. Intel added only 4% after hours on its fastest revenue growth since 2011. Super Micro's 26% on a record backlog was the exception.
There is a straightforward reason for this. After the first half's rally, expectations already sit in the winners' prices, and the hurdle is no longer the analyst consensus but the stock's own chart. The strongest reactions therefore came where expectations were low, namely 3M at 7%, General Motors at 5% and AT&T at 4%. For preparing the mega-cap week this means a beat alone is no long thesis. A strong report into a stretched chart is more often a selling event than a buy signal.
| Beleg | Read | Muster |
|---|---|---|
| Tesla -14% after EPS $0.33 vs $0.53 | Valuation without a margin cushion | Misses get punished hard |
| Alphabet -7% despite revenue +24% | Capex guidance beats the result | Good report, expensive future |
| Intel +4% on its best quarter since 2011 | After +163% YTD the price is the hurdle | Blowout, restrained reaction |
| 3M +7%, GM +5%, T +4% | Skepticism in the price is the best tailwind | Low hurdles get paid |
| Super Micro +26% on a record backlog | Direct capex recipient with proof | The recipient exception |
- Tesla -14% after EPS $0.33 vs $0.53
- Read
- Valuation without a margin cushion
- Muster
- Misses get punished hard
- Alphabet -7% despite revenue +24%
- Read
- Capex guidance beats the result
- Muster
- Good report, expensive future
- Intel +4% on its best quarter since 2011
- Read
- After +163% YTD the price is the hurdle
- Muster
- Blowout, restrained reaction
- 3M +7%, GM +5%, T +4%
- Read
- Skepticism in the price is the best tailwind
- Muster
- Low hurdles get paid
- Super Micro +26% on a record backlog
- Read
- Direct capex recipient with proof
- Muster
- The recipient exception
Economic Calendar: The Fed Week Begins
The most important date of the coming week is July 29. The Fed decides at a meeting without new projections, and consensus expects unchanged rates at 3.50 to 3.75%. Futures markets, however, price a 25 to 46% probability of a 25 basis point hike depending on the measure. That is not a footnote. The 10-year yield sits at a two-month high of 4.66%, and oil above $94 hands the hawks another argument. Running into an open Fed meeting on a broken trend and red breadth is not an environment for full position sizes.
What Changed The Weekly Plan
Initial jobless claims
Durable goods orders (June)
CXMT IPO Shanghai
Kimi K3 weights release
Fed rate decision and press conference
Breadth: One Accumulation Day Is Not a Trend
The daily counts show how narrow the base is. Monday closed with 132 stocks up more than 4% against 215 down more than 4%. Tuesday flipped the ratio to 473 versus 132, Wednesday fell back to 160 versus 240, and Thursday delivered the clearest distribution day of the week at 137 versus 319. Friday closed negative again at 316 versus 505. A single accumulation day between three distribution days is not enough for a turn. At the weekly close 48.6% of stocks hold above their 50-day line, which is less than half the universe for the first time again.
For weekly preparation that means a breakout needs its own group behind it, not the index. As long as breadth stays red, any breakout from a group that is not leading is statistically a failed-breakout candidate, all the more in summer trade with thinner liquidity.
Rotation: Energy and Substance Against Digital
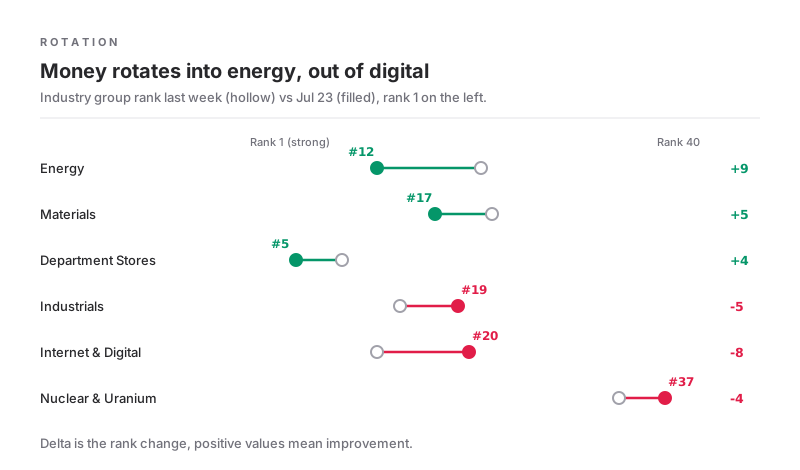
The week's rank moves all point the same way. Energy jumps from rank 21 to 12, materials from 22 to 17, and department stores advance from 9 to 5. On the other side internet and digital falls from 12 to 20, industrials slip from 14 to 19, and nuclear and uranium continues its distribution at rank 37. Capital is leaving the expensive digital names and going where cash flow already arrives today, so to refiners, materials and underrated retail.
This is reallocation within the risk budget and not risk-off, because semiconductors are returning to rank 2 at the same time. The read invalidates if energy fails to hold its new rank zone, or if oil gives back the geopolitical premium after a diplomatic opening.
Group Strength: The Top of the Standings
Three very different areas sit side by side at the top of the industry standings: asset managers as steady leadership, the returning semiconductor complex, and hardware as its infrastructure side. Department stores follow at rank 5, a group almost nobody has on a watchlist. That is exactly why it is worth a second look.
| Group | Rank | Status | Vorwoche |
|---|---|---|---|
| Investment Managers | 1 | Leading, holds the top spot | 1 |
| Semiconductors | 2 | Return after last week's selloff | under pressure |
| Hardware, Equipment & Parts | 3 | AI infrastructure, DELL as leader | 3 |
| Technology Distributors | 4 | Stable in the top group | 4 |
| Department Stores | 5 | Riser, +4 ranks | 9 |
- Investment Managers
- Rank
- 1
- Status
- Leading, holds the top spot
- Vorwoche
- 1
- Semiconductors
- Rank
- 2
- Status
- Return after last week's selloff
- Vorwoche
- under pressure
- Hardware, Equipment & Parts
- Rank
- 3
- Status
- AI infrastructure, DELL as leader
- Vorwoche
- 3
- Technology Distributors
- Rank
- 4
- Status
- Stable in the top group
- Vorwoche
- 4
- Department Stores
- Rank
- 5
- Status
- Riser, +4 ranks
- Vorwoche
- 9
Dossier 1: The Capex Question
Alphabet invested $45 billion in the second quarter and raised its full-year plan to $205 billion. Tesla grew spending 142% to $5.79 billion, slid to negative free cash flow of $1.09 billion and guided another $16.7 billion of spending for the second half.
At Tesla the revenue quality deserves the closer look, because the selloff was severe. The stock closed Thursday down 14%, the largest mega-cap daily loss of this reporting season, and Alphabet lost 7%. What carried the quarter was automotive at $20.52 billion (+23% on record deliveries of 480,126 vehicles), services at $4.58 billion (+50%, including 1.48 million active FSD subscriptions at record margin) and energy at $3.14 billion (+13%). The GAAP profit, however, includes an unrealized $1.005 billion valuation gain on the SpaceX stake, which Tesla itself excludes from its non-GAAP figures. Operationally, $398 million and a 1.4% margin remain. That paper gain is marked on SPCX, and SPCX closed Thursday at $115.26, roughly 15% below its $135 IPO price, with the lock-up expiring in August. This observation comes from issue 005. What was sold, then, was not the revenue but the quality of the profit behind it. Both reports carry the same message. The AI buildout is real, it is paid out of the company's own pocket, and that pocket is now valued the way it would be at any other industrial company.
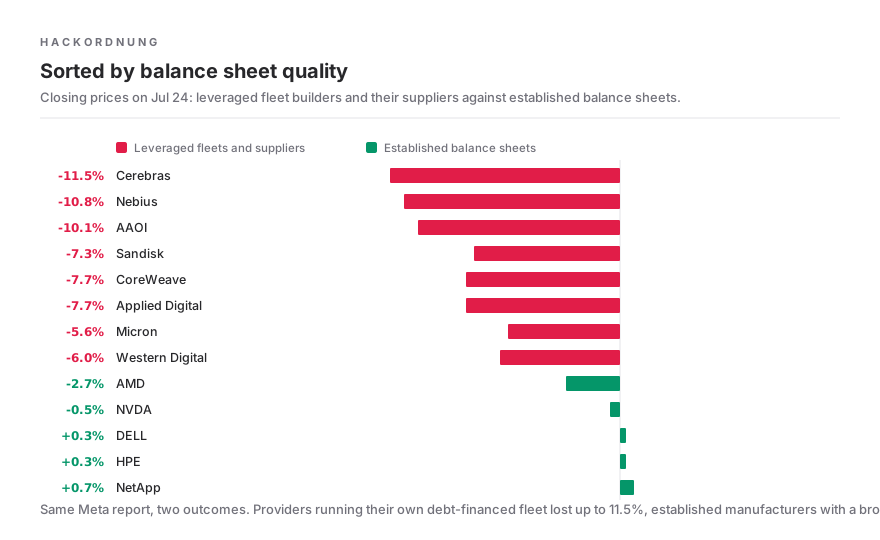
For a momentum trader this is a selection rule. Capital flows from the companies paying for the buildout to the ones earning from it. Super Micro with a record backlog and +26%, DELL at RS 99 and semiconductors at rank 2 sit on the receiving side. On Friday that read sharpened. Reports that Meta is exploring selling excess compute hit the neoclouds hard, because Meta represents about $21 billion of commitments at CoreWeave and $27 billion at Nebius. When the largest customer becomes a supplier itself, investors sort by balance sheet quality immediately. Cerebras, Nebius (NBIS), Applied Optoelectronics (AAOI), CoreWeave (CRWV) and Applied Digital (APLD) closed between 7.7 and 11.5% lower, while Dell (DELL), Hewlett Packard Enterprise (HPE) and NetApp (NTAP) held green and Nvidia (NVDA) gave up only 0.5%. The receiving side is no longer one block. The read flips if one of the mega caps cuts spending next week and gets bought for it, because then capital discipline is suddenly what counts.
Dossier 2: The Pecking Order of AI Infrastructure
On Friday the receiving side of AI capex visibly split into two classes, and what separated them was the balance sheet. On one side stand the neoclouds and the miners that pivoted to AI. They build their GPU fleets on their own account, finance that through debt and dilution, and depend on a handful of large customers. The report that Meta, one of those large customers, may market its own excess capacity hit exactly this construction. Cerebras closed 11.5% lower, Nebius (NBIS) 10.8%, the optics supplier Applied Optoelectronics (AAOI) 10.1%, and CoreWeave (CRWV) and Applied Digital (APLD) 7.7% each.
On the other side stand established manufacturers with a broad customer base and a self-supporting balance sheet. Dell (DELL), Hewlett Packard Enterprise (HPE) and NetApp (NTAP) held green on the same day, and Nvidia (NVDA) gave up only 0.5%. They earn from the buildout itself rather than from the utilization of a leveraged fleet, and a Meta that markets its own compute still keeps ordering servers. For the playbook this means balance sheet quality is now a first-order selection criterion inside the AI theme. In the table, Friday's reactions are grouped along this screen, each with a note on whether it is a closing price or an intraday reading.
| Klasse | Read | Risiko | Beispiele |
|---|---|---|---|
| Neocloud, own fleet | The Meta report hits the business model | Customer concentration, debt, dilution | Nebius (NBIS) -10.8%, CoreWeave (CRWV) -7.7% (close) |
| AI chip challenger | High beta to every capex headline | Few large buyers | Cerebras -11.5% (close) |
| Miner pivot to AI | The second row falls with the first | Capital intensive, young contracts | Applied Digital (APLD) -7.7% (close); IREN (IREN) -6%, Cipher Mining (CIFR) -6%, Hut 8 (HUT) -4% (intraday) |
| Fleet suppliers | Tied to the buildout pace of the leveraged | Order cycles of the neoclouds | Applied Optoelectronics (AAOI) -10.1% (close); Marvell (MRVL) -7%, Ouster (OUST) -8% (intraday) |
| Established balance sheets | The survivors of the pecking order, DELL stays the study | Lowest single-customer dependency | Dell (DELL) +0.3%, Hewlett Packard Enterprise (HPE) +0.3%, NetApp (NTAP) +0.7%, Nvidia (NVDA) -0.5% (close) |
- Neocloud, own fleet
- Read
- The Meta report hits the business model
- Risiko
- Customer concentration, debt, dilution
- AI chip challenger
- Read
- High beta to every capex headline
- Risiko
- Few large buyers
- Beispiele
- Cerebras -11.5% (close)
- Miner pivot to AI
- Read
- The second row falls with the first
- Risiko
- Capital intensive, young contracts
- Fleet suppliers
- Read
- Tied to the buildout pace of the leveraged
- Risiko
- Order cycles of the neoclouds
- Established balance sheets
- Read
- The survivors of the pecking order, DELL stays the study
- Risiko
- Lowest single-customer dependency
Dossier 3: Memory Answers the Supply Question
Issue 005 framed the CXMT worry as a concrete supply risk for the memory cycle and required a base with fading sell volume as the complex's proof. The answer came faster and sharper than expected, with Micron up 12% in a day, Sandisk up 14%, the SOX up 5% and the group back at rank 2. Memory scarcity was traded as a demand story for now, not as a margin threat.
The test then arrived faster than the calendar. A Korean broker estimate 8% below SK Hynix consensus on slower HBM4 shipments sent SK Hynix down 15% for its largest daily loss ever. Micron closed 5.6% lower, Sandisk 7.3%, and Western Digital gave way as well. After +243% at Micron and +707% at Sandisk year to date that is no collapse, but it shows that a V rally without a base forgives no mistakes.
Intel delivered the fundamental proof for the complex on Thursday evening, with 25% revenue growth, its fastest quarter since 2011 and Q3 guidance clearly above consensus. That the stock added only 4% after hours and handed the gain back on Friday fits the week's pattern. After the rally the hurdle is the stock's own price, no longer the consensus. What is confirmed is the return of the complex, not a new uptrend. The next test arrives July 27 with the CXMT IPO in Shanghai, which puts a price on additional Chinese supply. If the complex absorbs that news with tight daily ranges, the base is sound. Fresh vertical single-day gains without consolidation would be an overshoot that is not to be chased.
Dossier 4: Energy as a Hedge That Pays
The escalation in oil came in two stages. First the ninth night of American strikes on Iran drove Brent to $94.07. Then Houthi attacks on two Saudi tankers in the Bab el-Mandeb and a declared naval blockade moved the conflict to the tanker front, and Brent tested $100 on Thursday for the first time since May, up 6.3% intraday, while WTI rose above $91. The equity market buys the hedge directly in the group ranks. Energy climbs nine ranks, refiners Valero (VLO), Marathon Petroleum (MPC) and Phillips 66 (PSX) gained 2.1 to 2.6% against a falling tape on Thursday, Marathon Petroleum leads July's large-cap standings at +21%, and DK and PARR hold RS ratings of 97 to 98 near their highs. The industry itself is consolidating too, with Var Energi announcing the $1.3 billion acquisition of BlueNord on July 21, which creates Europe's largest independent oil and gas producer.
The trade carries binary risk in both directions. A diplomatic opening, as Iran's foreign ministry hinted on Monday, would drain the geopolitical premium quickly. A disruption of the Strait of Hormuz would extend it, but likely alongside a broad selloff through the rates channel, because the 10-year already sits at a two-month high of 4.66%. Position size and stop therefore belong tighter than the pure chart suggests.
Dossier 5: The Space Complex and the Price of Duration
The space complex shows what rising yields do to long-dated growth stories. SPCX traded at 112.76 intraday on Friday, roughly 16% below its $135 IPO price, Rocket Lab (RKLB) lost 7% the same day and AST SpaceMobile (ASTS) nearly 5%. No single company event explains that breadth. The common denominator is discounting, because with the 10-year yield at a two-month high of 4.66%, cash flows that arrive years from now lose present value fastest. The sector currently trades like a rates derivative, regardless of whether the rockets fly.
For SPCX there is homemade supply pressure on top, which issue 005 set up as a watch item. The lock-up expires in August, putting additional shares into circulation while early subscribers already sit under water. Tesla's balance sheet connects both worlds, because the reported $1.005 billion paper gain on the SpaceX stake hangs on exactly this price. The playbook is unchanged. The complex is a case study in post-IPO supply pressure and not a long candidate while yields rise and the lock-up looms. A rethink would need a yield retreat below the recent zone together with a first accumulation base above the IPO price.
Follow-Up: What Became of Issue 005's Expectations
The QQQ reclaim of the 50-day line has not been delivered, none of the three core indexes trades in a bullish short-term trend, and index exposure stays reduced accordingly. The demanded semiconductor base arrived with far more force than expected, though as a V-shaped rally rather than an orderly consolidation, which lowers the quality of the base. Cybersecurity leadership has migrated into the software infrastructure standings, where FTNT holds the line at RS 96 in a tight range above its 20-day line. Hormuz remained the dominant oil driver and the diplomatic opening did not come. The CXMT IPO and the Kimi K3 weights release are both dated July 27 and carry into next week as open expectations.
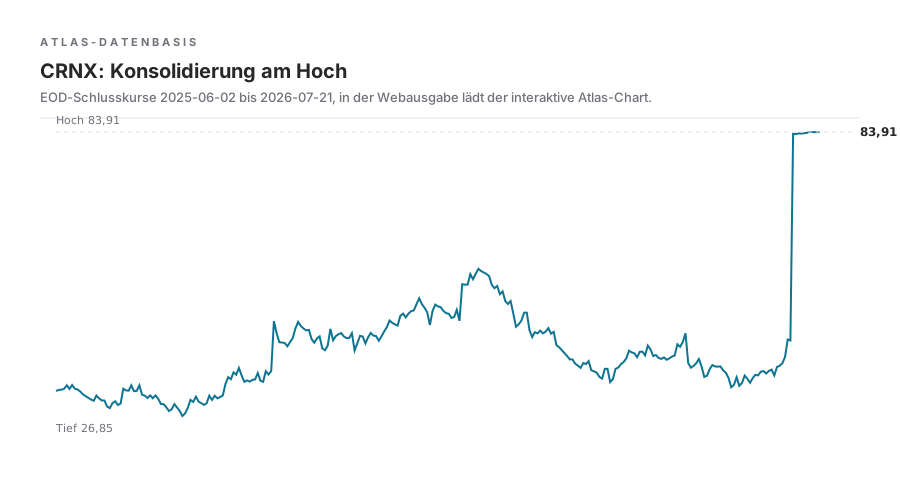
One candidate earns a second look. CRNX was rejected in issue 005 because no base stood after the vertical gap. Exactly that base has formed since, the stock consolidates flat at the high and therefore graduates to a study in this issue. The screen worked as designed, structure first and inclusion second.
Earnings Reactions: What Got Paid For
The week's pattern is clear. The low expectation hurdle got paid, the expensive future got punished. Value names with solid beats like 3M and General Motors ran 5 to 7%, and Super Micro's record backlog earned 26% because the company sits on the receiving side of AI capex. Alphabet and Tesla show that growth no longer carries a stock when the investment bill grows at the same pace.
| Lektion | Ergebnis | Reaction | Unternehmen |
|---|---|---|---|
| Recipients of AI capex get paid | Record order backlog | +26% | Super Micro |
| After a 163% yearly run a blowout only earns a restrained reaction | Revenue $16.1B (+25%), EPS doubled vs consensus, Q3 guidance above expectations | +4% after hours | Intel |
| Value beats run, the hurdle is low | Q2 above expectations | +7% | 3M |
| Cyclicals priced with skepticism react best | Beat on revenue and earnings | +5% | General Motors |
| The buildout's bill is being valued | Revenue +24%, Cloud +82%, capex plan $205B | -4% after hours | Alphabet |
| Revenue quality counts for more than revenue size, paper gains carry no trade | Revenue +26%, EPS $0.33 vs $0.53 expected, GAAP carried by a $1.005B SpaceX paper gain | -5% after hours, -5.9% premarket Thursday | Tesla |
- Recipients of AI capex get paid
- Ergebnis
- Record order backlog
- Reaction
- +26%
- Unternehmen
- Super Micro
- After a 163% yearly run a blowout only earns a restrained reaction
- Ergebnis
- Revenue $16.1B (+25%), EPS doubled vs consensus, Q3 guidance above expectations
- Reaction
- +4% after hours
- Unternehmen
- Intel
- Value beats run, the hurdle is low
- Ergebnis
- Q2 above expectations
- Reaction
- +7%
- Unternehmen
- 3M
- Cyclicals priced with skepticism react best
- Ergebnis
- Beat on revenue and earnings
- Reaction
- +5%
- Unternehmen
- General Motors
- The buildout's bill is being valued
- Ergebnis
- Revenue +24%, Cloud +82%, capex plan $205B
- Reaction
- -4% after hours
- Unternehmen
- Alphabet
- Revenue quality counts for more than revenue size, paper gains carry no trade
- Ergebnis
- Revenue +26%, EPS $0.33 vs $0.53 expected, GAAP carried by a $1.005B SpaceX paper gain
- Reaction
- -5% after hours, -5.9% premarket Thursday
- Unternehmen
- Tesla
Leader Universe: 49 Stocks Pass the Screen
On Friday morning the scanner counts 49 stocks passing the full leader screen: RS rating of at least 90, at most 15% below the 52-week high, at least 20% three-month momentum, ADR from 3% and dollar volume from $15 million. Thursday knocked nine names out of the screen, and leadership stays concentrated. Biotechnology supplies most of the strongest names, joined by refiners, hardware and software infrastructure. What held is telling. CRNX closed the distribution day unchanged at its high, DELL gave up only 0.6%, and Micron gained 2.9% against the tape.
For the Atlas review, three studies were chosen from three different leading groups, namely CRNX from biotechnology, DELL from AI hardware and PARR from the refiner block. DK, last issue's refiner study, holds its setup at RS 98 and 4.2% off the high, so that follow-up check is positive.
Biotechnology. Flache Konsolidierung am Hoch. RS 99
RS 99, Drei-Monats-Lauf 109%, 258 Mio USD Dollarvolumen. In Ausgabe 005 wegen fehlender Basis verworfen, die Basis steht jetzt.
Hardware, Equipment & Parts. Stage-2-Fortsetzung, Empfänger des AI-Capex. RS 99
Liquidester Name im Raster mit 4,2 Mrd USD Dollarvolumen und 108% Drei-Monats-Momentum.
Oil & Gas Refining & Marketing. Refiner am 52-Wochen-Hoch. RS 97
Energie ist der größte Rang-Aufsteiger der Woche, die Refiner-Gruppe führt den Leadership-Pfeiler mit an.
Atlas Study 1: CRNX at the Pivotal Point
Crinetics Pharmaceuticals stands at RS 99 practically at its 52-week high, the distance is 0.2%. The three-month run of 109% is carried by approval and trial news, and average dollar volume of $258 million gives the name institutional liquidity. The structure shows a flat consolidation right under the high, the picture of a stock held by strong hands.
For the coming week the rule is simple. A breakout only counts with volume above the 50-day average and a close above the pivotal point. The setup invalidates on a daily close below the 20-day line on elevated volume. In biotechnology that invalidation is to be taken strictly, because news creates gaps here.
Atlas Study 2: DELL as the Liquid AI Recipient
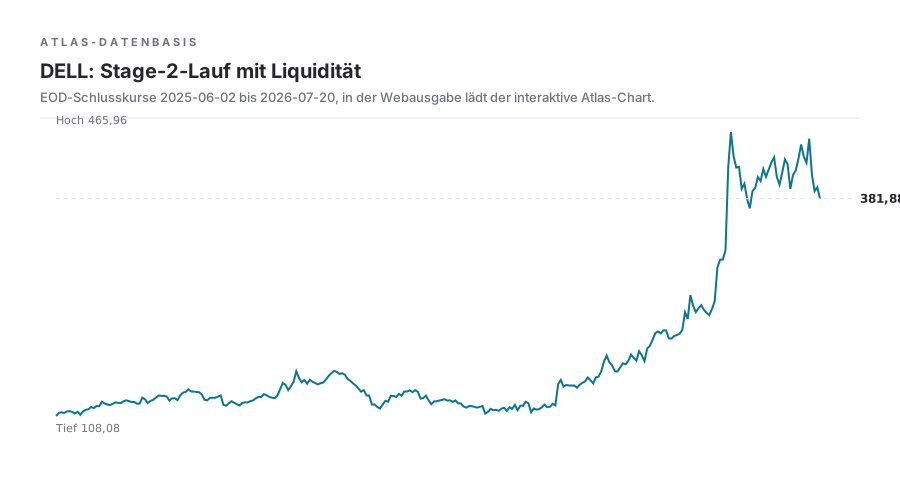
DELL combines RS 99 with three-month momentum of 108% and dollar volume of $4.2 billion, which makes it the most liquid name in the entire leader screen. As a server builder it sits on the receiving side of this issue's capex theme, because every raised spending plan among the mega caps turns into backlog here. The 5.8% distance from the high leaves room for a base, and the 7.4% ADR demands wide stops.
The checklist is short. A sideways range of at least five days above the 20-day line would be the buyable base, and chasing the current move is forbidden by the regime. The study invalidates if Microsoft or Meta report lowered spending plans on July 29, because that would remove the backlog argument.
Atlas Study 3: PARR With the Refiner Tailwind
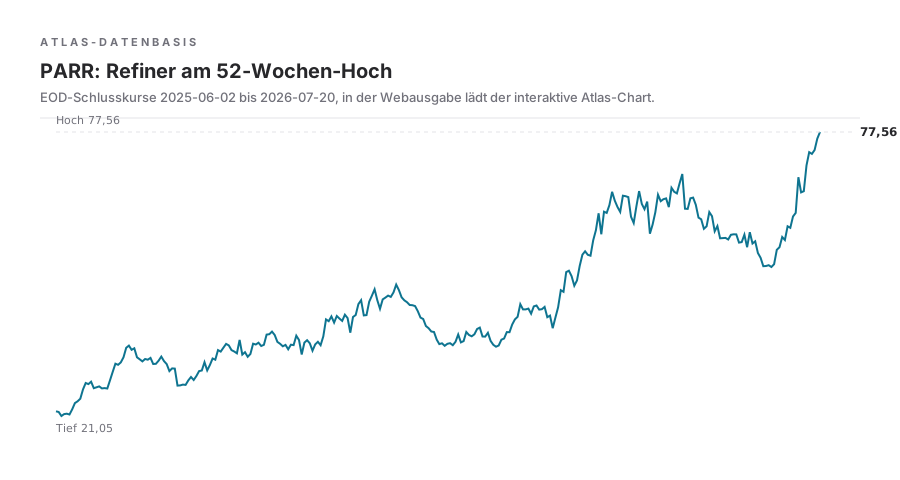
Par Pacific trades at RS 97 at its 52-week high. Oil and gas refining belongs to the leadership pillar's top groups, and energy is the week's biggest rank riser. At $83 million in dollar volume the name is tradable but far tighter than DELL, and position size has to reflect that.
The preferred structure is a pullback to the 10- or 20-day line on fading volume, with no buying into a stretched daily move after oil headlines. The invalidation is twofold: technically the loss of the 20-day line, fundamentally a diplomatic opening in the Iran conflict that would deflate the crack spread story.
Tight Ranges: Candidates in Waiting
Nine stocks from the leader environment trade in a tight range at the 20-day line and less than 8% below their highs. That is the raw material for the next breakouts. Notable is the clustering in software infrastructure with FTNT and ATEN and in medical devices with AVNS, because the candidates come from the very groups the leadership pillar already leads with.
| Symbol | RS | Group | Vom Hoch | Abstand 20T |
|---|---|---|---|---|
| AVNS | 97 | Medical devices | -2.2% | 0.0% |
| FTNT | 96 | Software infrastructure | -7.6% | +1.5% |
| ATEN | 94 | Software infrastructure | -6.3% | -0.6% |
| RSI | 94 | Gaming | -7.2% | +0.6% |
| ENVA | 93 | Consumer credit | -7.4% | +0.6% |
| CRS | 92 | Specialty metals | -6.4% | -0.3% |
- RS
- 97
- Group
- Medical devices
- Vom Hoch
- -2.2%
- Abstand 20T
- 0.0%
- RS
- 96
- Group
- Software infrastructure
- Vom Hoch
- -7.6%
- Abstand 20T
- +1.5%
- RS
- 94
- Group
- Software infrastructure
- Vom Hoch
- -6.3%
- Abstand 20T
- -0.6%
- RS
- 94
- Group
- Gaming
- Vom Hoch
- -7.2%
- Abstand 20T
- +0.6%
- RS
- 93
- Group
- Consumer credit
- Vom Hoch
- -7.4%
- Abstand 20T
- +0.6%
- RS
- 92
- Group
- Specialty metals
- Vom Hoch
- -6.4%
- Abstand 20T
- -0.3%
Reviewed and Rejected
Three candidates fail on concrete criteria. AZUL carries the steepest move of the screen at 466% three-month momentum, but $18 million of dollar volume is too thin for that vertical, and an entry would be chasing against our own rule. Vermilion Energy tops the EP watchlist but breaks the leader screen on two core points with RS 64 and negative three-month momentum, and its July 29 report adds gap risk. Super Micro has no tradable structure after +26% in one day, and only a multi-day base above the breakout level would put the name back on the candidate list.
466% Drei-Monats-Momentum, aber nur 18 Mio USD Dollarvolumen: zu dünn für die Vertikale.
Steilheit ersetzt keine Liquidität.
Rang 1 der EP-Watchlist, aber RS 64 und negatives Drei-Monats-Momentum reißen das Raster, Zahlen am 29.07. als Gap-Risiko.
Eine Watchlist ist kein Setup.
+26% an einem Tag auf Rekord-Backlog: keine handelbare Struktur, Nachlaufen verboten.
Erst die Basis über dem Ausbruchsniveau macht den Wert wieder zum Kandidaten.
Macro Frame: Yields as the Opponent in the Background
The 10-year yield has pushed to a two-month high of 4.66%, driven by the oil premium and the possibility of a Fed hike. The VIX nonetheless fell 2.4% to 16.64 on Wednesday, so the options market prices the event week remarkably calm. Gold held near its highs at $4,132, bitcoin eased to $66,079. The combination of rising yields and falling volatility is unstable, one of the two will give way, and the Fed meeting on Tuesday and Wednesday is the most likely trigger. On Friday oil handed back part of the weekly premium, which stabilized the indexes without saving the week. The dollar index sat at 101.4 on Friday afternoon, a neutral reading that closes the cross-asset gap named earlier.
Three Paths Through July 29
The Fed meeting is the most important date of the coming week, and because futures markets price a 25 to 46% probability of a hike depending on the measure, it is no formality. The three paths in the table are marked as expectations and not as forecasts, and each carries its own consequence for weekly preparation. All three share the same schedule. The decision lands at 2:00 pm ET, the press conference begins at 2:30, and Microsoft and Meta report that same evening after the close. Whoever trades that day without a plan is trading the volatility of three events at once.
| Playbook | Szenario | Read | Marktlesart |
|---|---|---|---|
| Trade A setups from leading groups normally, risk unit stays 0.25R until the regime turns above 60 | Hold with a balanced press conference | The consensus path | Yields stabilize, the trend pillar gets its chance at the 50-day reclaim |
| Keep playing the rotation, no positions in rate-sensitive long-duration names ahead of the mega-cap prints | Hold with a hawkish press conference | Warsh reaffirms readiness to hike | Yields stay at the two-month high or rise, duration and neoclouds stay under pressure, energy and value relatively strong |
| Reduce exposure rather than defend it, the regime decides, cash is a position | A 25 basis point hike | Priced at 25 to 46% by futures, not a tail case | Stress test for the trend pillar, likely a second distribution push, oil above 90 reinforces the inflation read |
- Trade A setups from leading groups normally, risk unit stays 0.25R until the regime turns above 60
- Szenario
- Hold with a balanced press conference
- Read
- The consensus path
- Marktlesart
- Yields stabilize, the trend pillar gets its chance at the 50-day reclaim
- Keep playing the rotation, no positions in rate-sensitive long-duration names ahead of the mega-cap prints
- Szenario
- Hold with a hawkish press conference
- Read
- Warsh reaffirms readiness to hike
- Marktlesart
- Yields stay at the two-month high or rise, duration and neoclouds stay under pressure, energy and value relatively strong
- Reduce exposure rather than defend it, the regime decides, cash is a position
- Szenario
- A 25 basis point hike
- Read
- Priced at 25 to 46% by futures, not a tail case
- Marktlesart
- Stress test for the trend pillar, likely a second distribution push, oil above 90 reinforces the inflation read
Methodology: Where This Issue's Numbers Come From
The regime score bundles nine pillars into one number between 0 and 100: index trend, market breadth, leadership, rates, dollar and energy, inflation, volatility, seasonality and your own traction. Each pillar is computed daily from market data, and the traffic-light color translates the score into a rule. Green allows full risk units, yellow reduces to 0.25R and A setups only, red means no new long risk. The score is deliberately built slow. A single down day does not flip it, a series of distribution days does.
The leader screen filters the full scanner universe of more than 4,600 stocks down to the names showing institutional leadership: an RS rating of at least 90, at most 15% below the 52-week high, at least 20% three-month momentum, an average daily range from 3% and dollar volume from $15 million. The Atlas studies grow out of this screen and never the other way around. Only structure in the chart turns a screen candidate into a study, and every study carries its invalidation in the text. Every external number in this issue sits in the source ledger at the end of the report with source and fetch time. Open values are marked open and get checked against actuals in the next issue.
Workflow: Preparing the Event Week
Ahead of a week with a Fed decision and four mega-cap reports, a fixed routine earns its keep. First, lay the position list against the calendar and note for every position which date can hit it. Second, cut the watchlist down to candidates from leading groups in tight ranges, where this issue's table is the starting point and not the result. Third, set alerts at the pivotal points instead of pre-planning entries, because in an open Fed week the reaction after the event decides and not the positioning before it. The scanner and the matrix take over the routine work, the decision stays with the plan.
Outlook: Five Checkpoints Through July 31
The first checkpoint is July 27 with the CXMT IPO and the announced Kimi K3 weights. Both test the AI complex, one from the supply side and one from the competition side. The second is the Fed on July 29. A hold as consensus expects leaves the press conference to set the direction of yields; a hike puts the regime's trend pillar to its next stress test. The third is Microsoft and Meta that same evening, the fourth Apple and Amazon on July 30, each measured against this issue's capex question. The fifth is breadth itself. A second accumulation day with more than 400 gainers above 4% would confirm Tuesday's strength and open the regime's path back above 60. If it fails to appear, Tuesday was a flash in summer trade.
For the watchlist the screen of this issue applies. CRNX, DELL and PARR are the reviewed studies, the tight-range table is the reservoir, and entries happen only with the group at your back and at 0.25R for as long as the regime stays yellow.