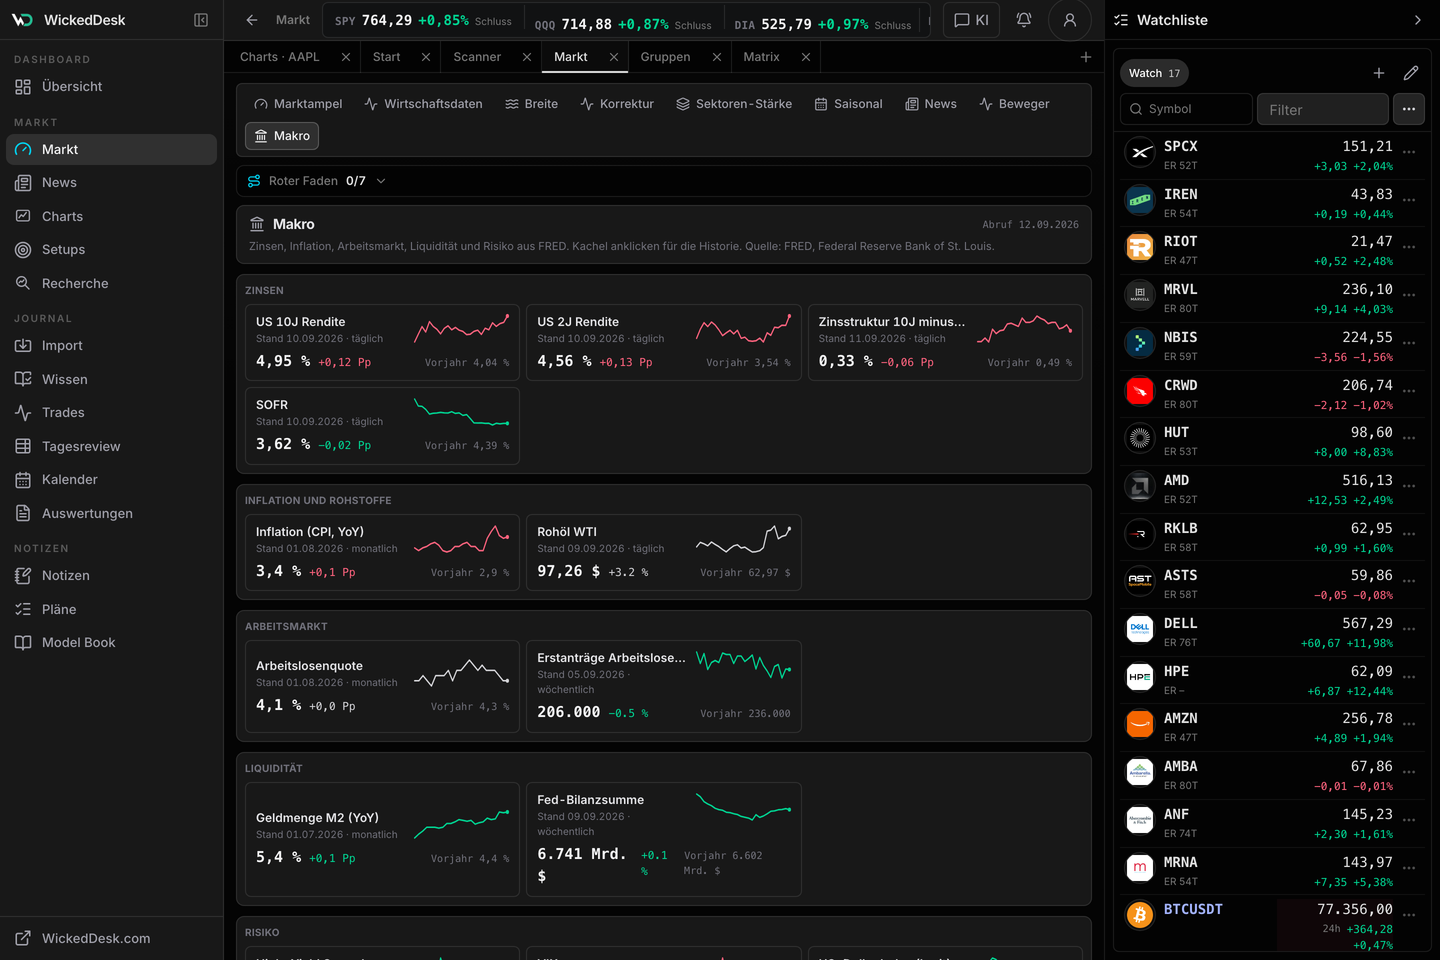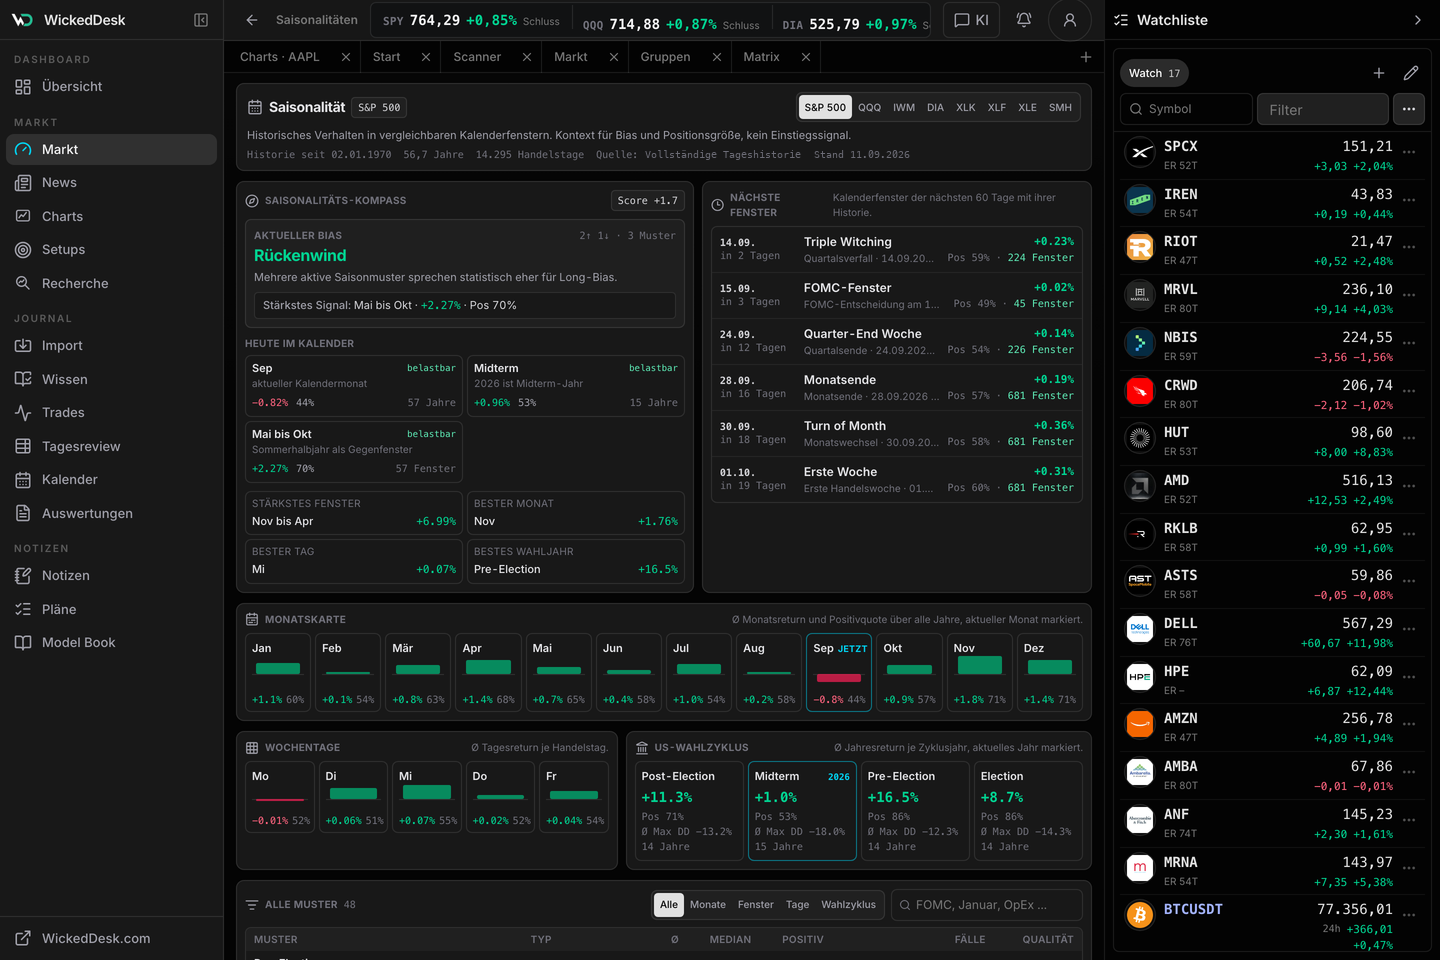

Less interface
Home, scanner, and Atlas show only what you need to check next.
Market first, then the group, then the stock. The same path on Sunday evening and every evening after, ending in a focus list where the alerts sit exactly where your decision happens.


Any scanner shows you what moved. After that it scatters: the chart in one tab, the screenshot in a folder, the thought on a note. By the time you enter, half of it is gone.
The plan is set, the alert keeps watch, the review knows both.
The chart is somewhere else
The scanner names the stock. What it is actually doing sits in the next tab.
Notes in four places
Screenshot in a folder, thought on a note, number in a spreadsheet. Together they add up to nothing.
You check everything, every day
Twenty stocks on the list, and you walk through all of them each evening because you cannot know when something happens.
The review comes too late
You review after the trade is done. By then the original reason is gone.
The market first, the stock last
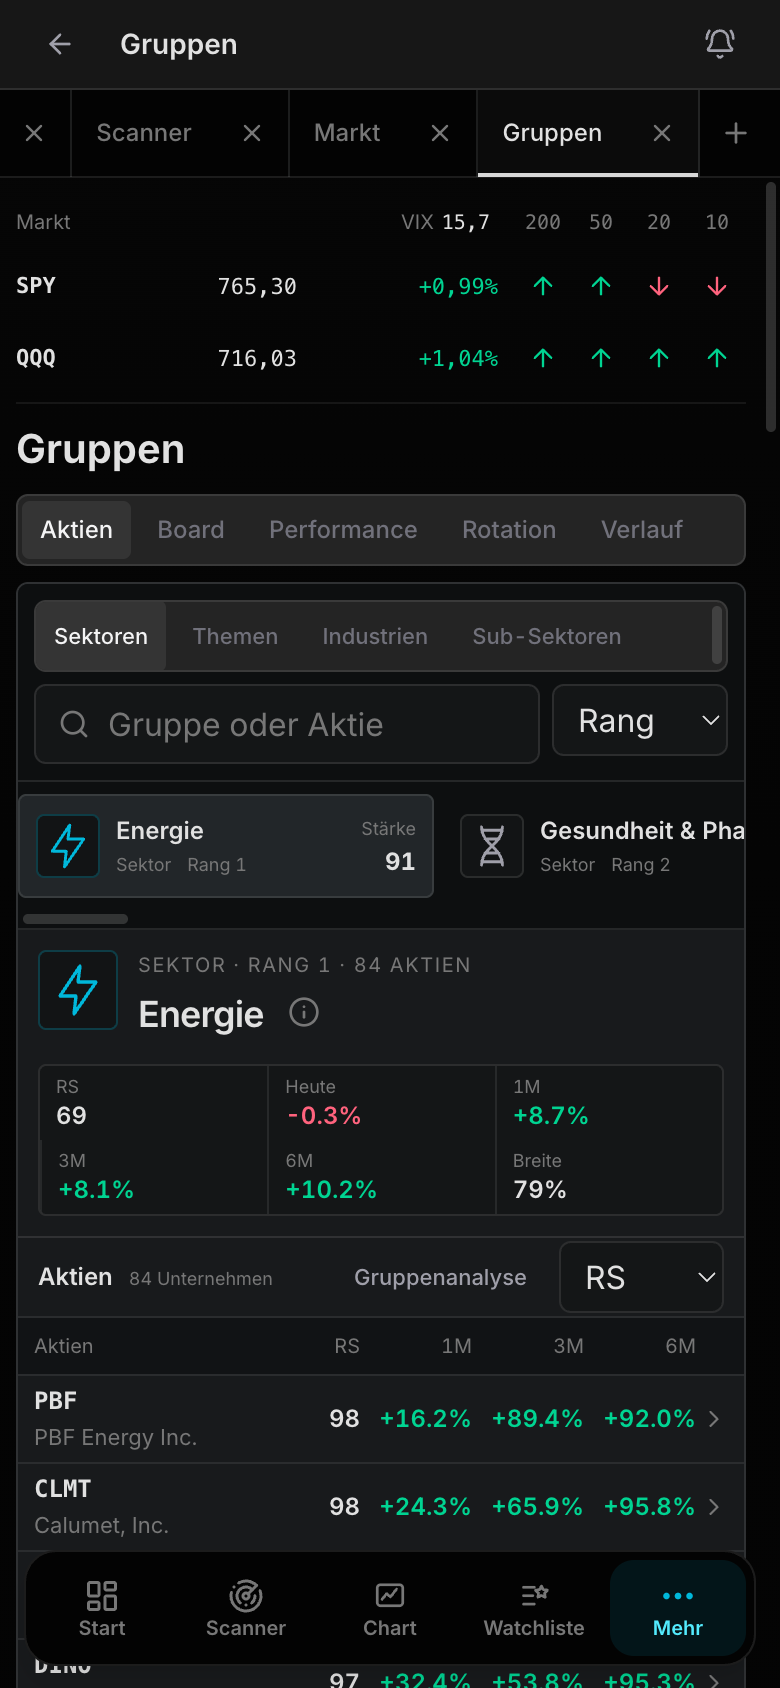
Preparation starts with the market signal and the group. The single stock comes last, not first.
One click and it is all there
Every stock you find opens with its chart, its dates, its group and related names in one window.
The alert sits on the price
You set it right in the chart, at the level where it gets interesting. Until then you do not have to look.
The review is attached to the prep
Your review draws on what you wrote down beforehand. Nothing to reconstruct.
Order matters more than speed. Six steps lead from the market backdrop to a finished watchlist: environment first, then the group, then the stock. Always the same path, on Sunday evening or after the close.
Market check
Market signal and breadth first. Long, neutral, or defensive?
Hot groups
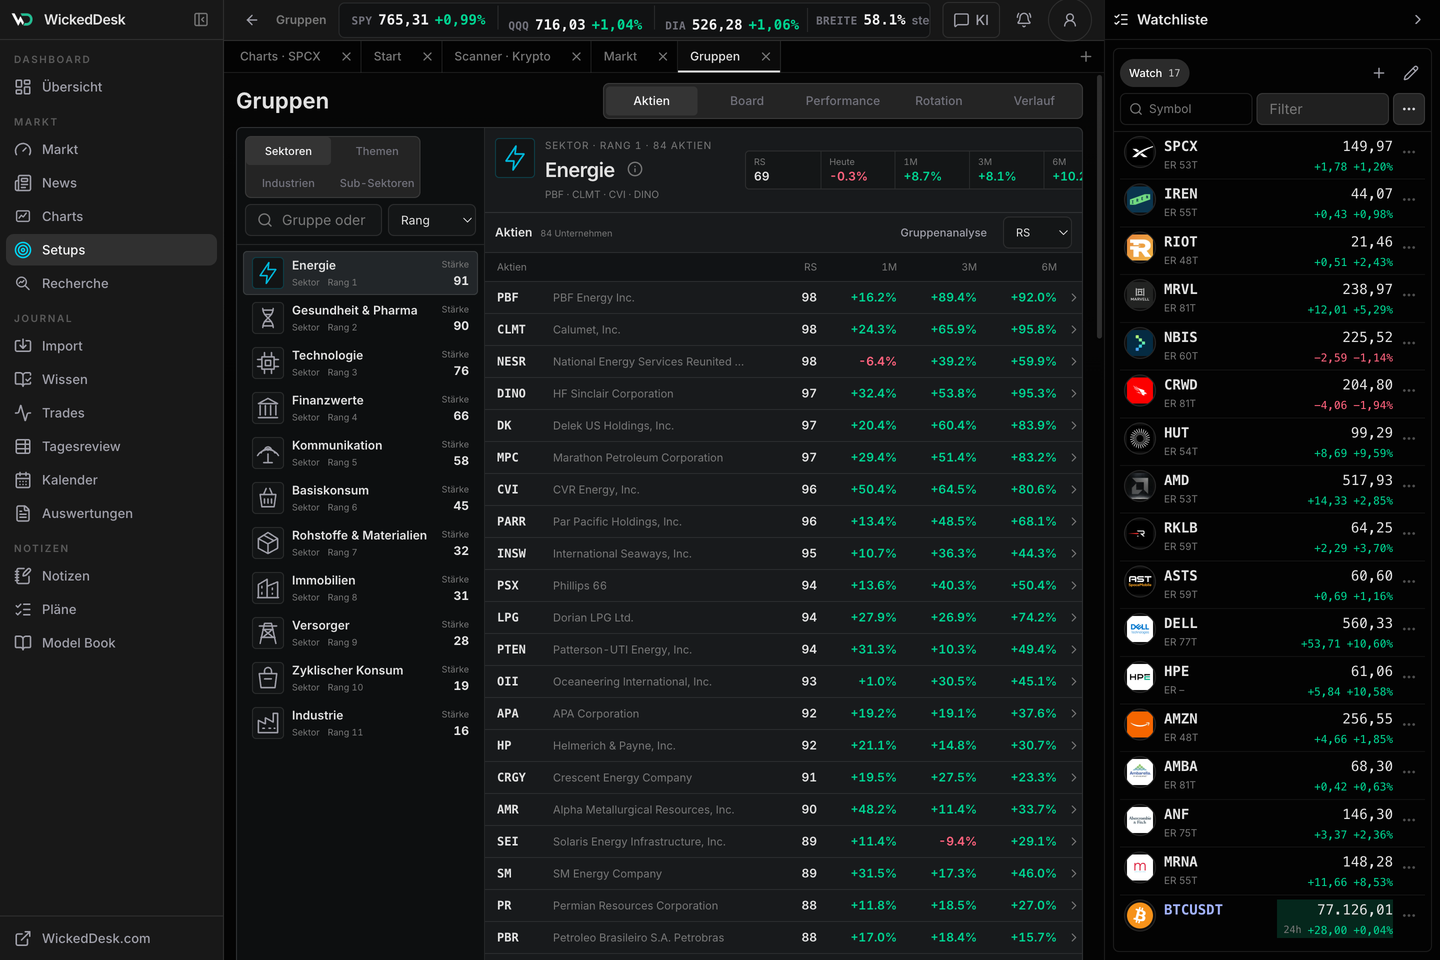
Where momentum runs, sorted by best/worst rotation.
Group detail
Which stocks carry the group: leaders and laggards.
Leaders
Strongest names near highs, clean trend, good structure.
Scanner
Concrete setups, ranked not raw: leaders, EPs, breakouts.
Focus list and plan
Save candidates and set the alert on the price that decides.
In the app this sequence lives as an optional guided flow above the Setups area. It remembers how far you got today and can be hidden in settings any time.
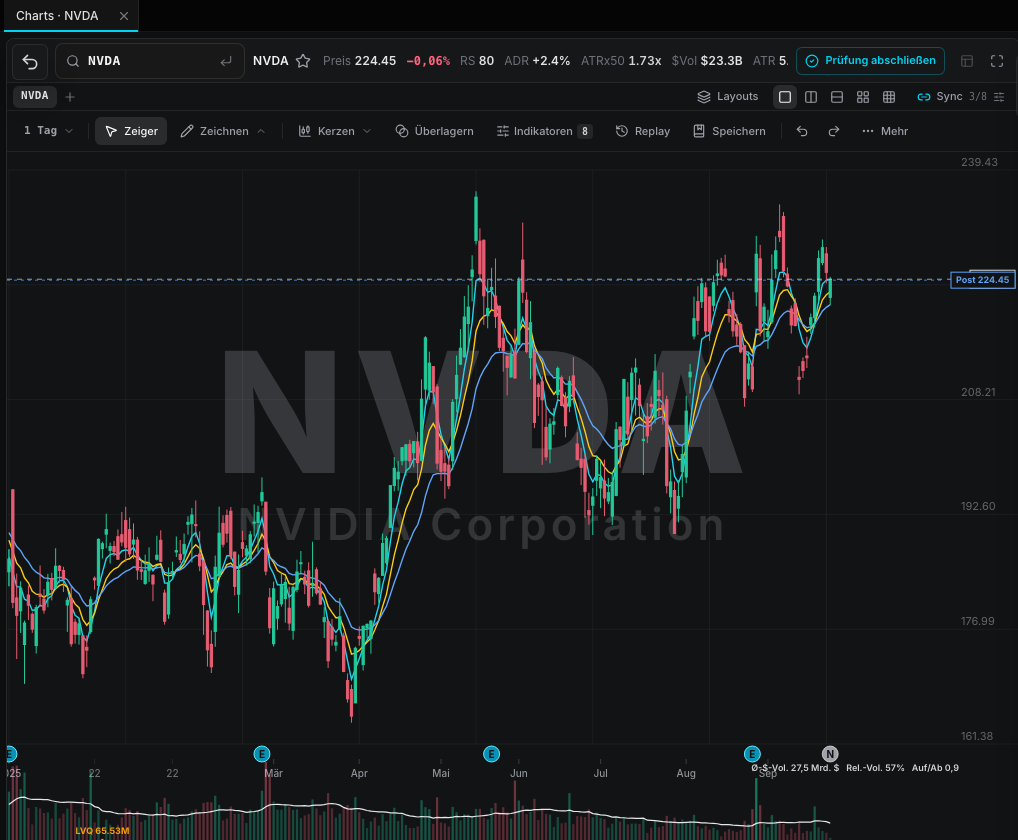
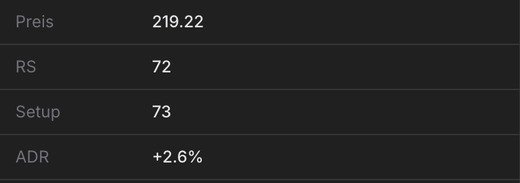
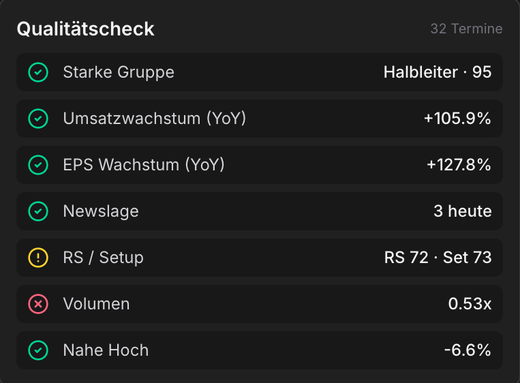
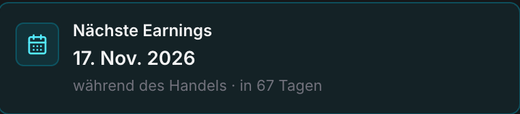
When Scanner, Matrix, or Weekly surfaces a ticker, Atlas keeps the full check in one view: trend, volume, earnings, news, catalysts, related stocks, and group strength next to the chart. You can tell whether a move stands alone or has market, group, and setup support.
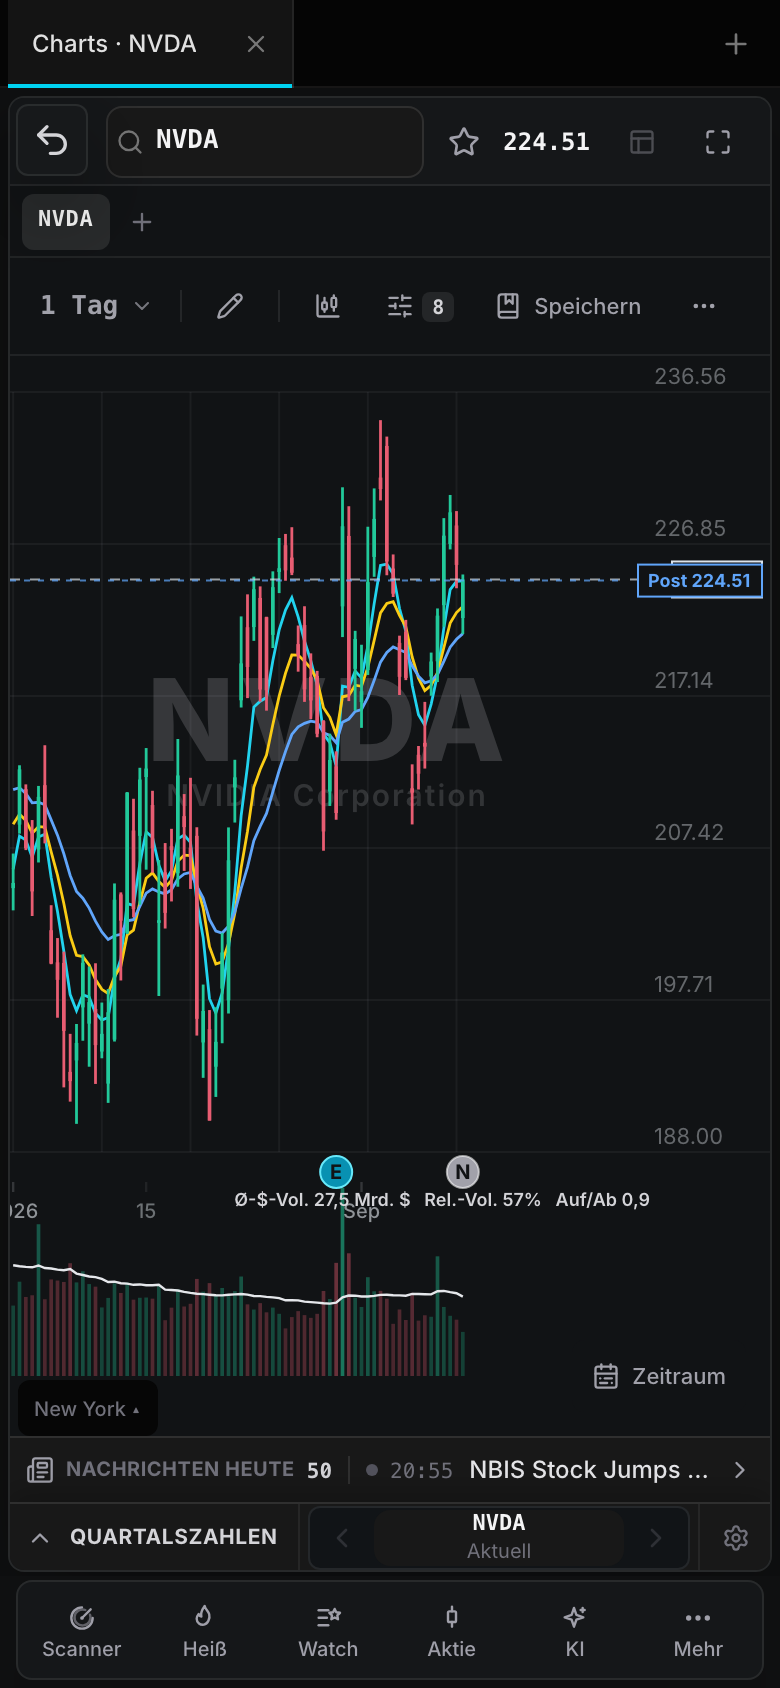
Proprietary chart engine with price, volume, moving averages, earnings markers, drawings, and mobile layouts.
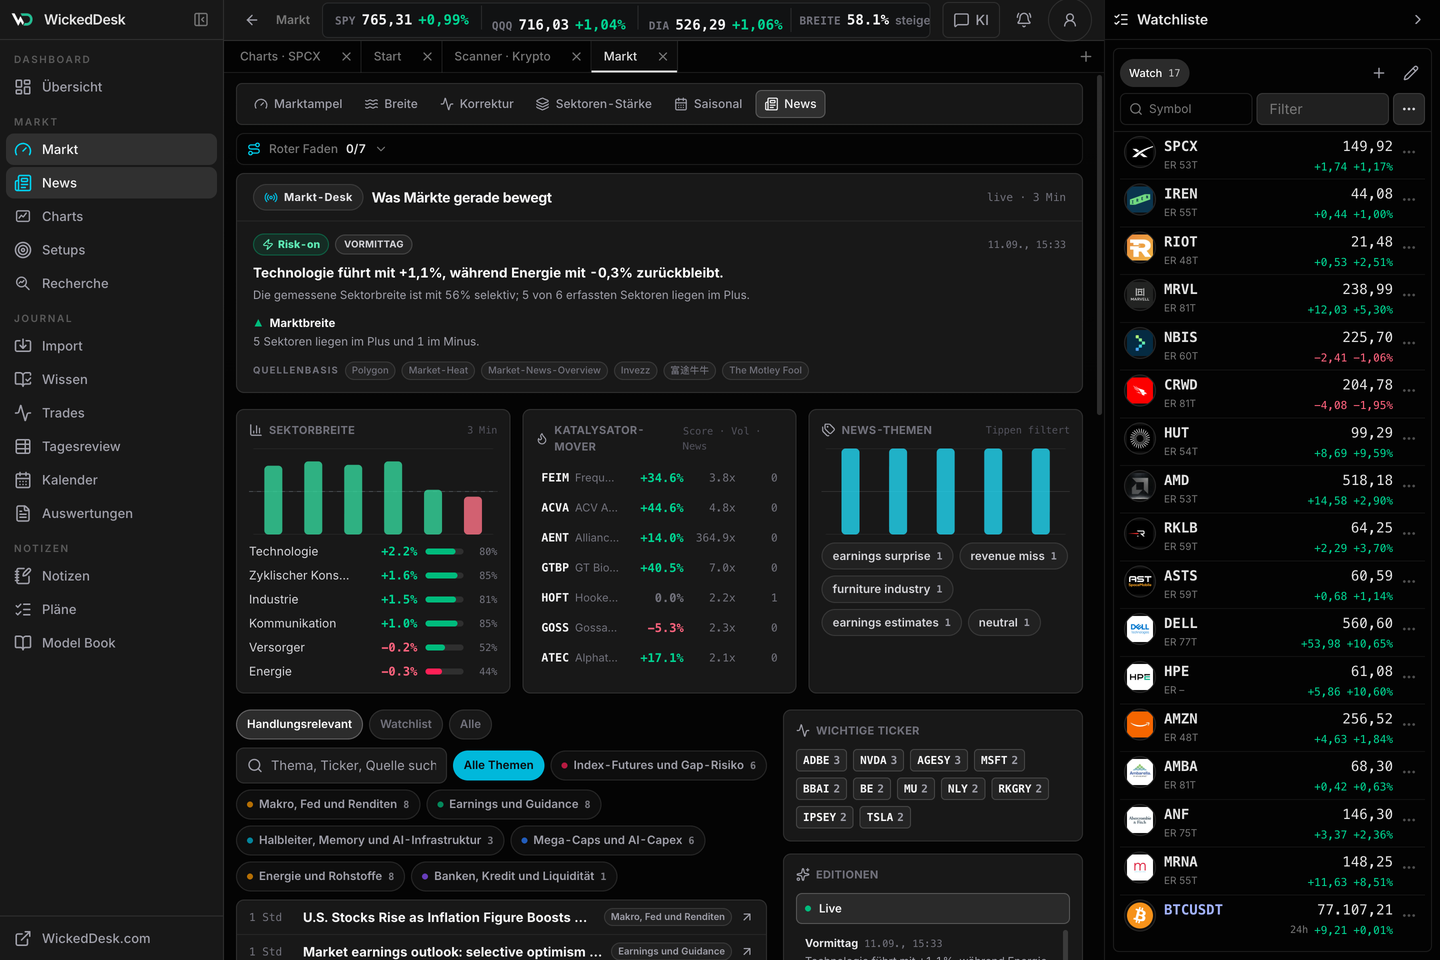
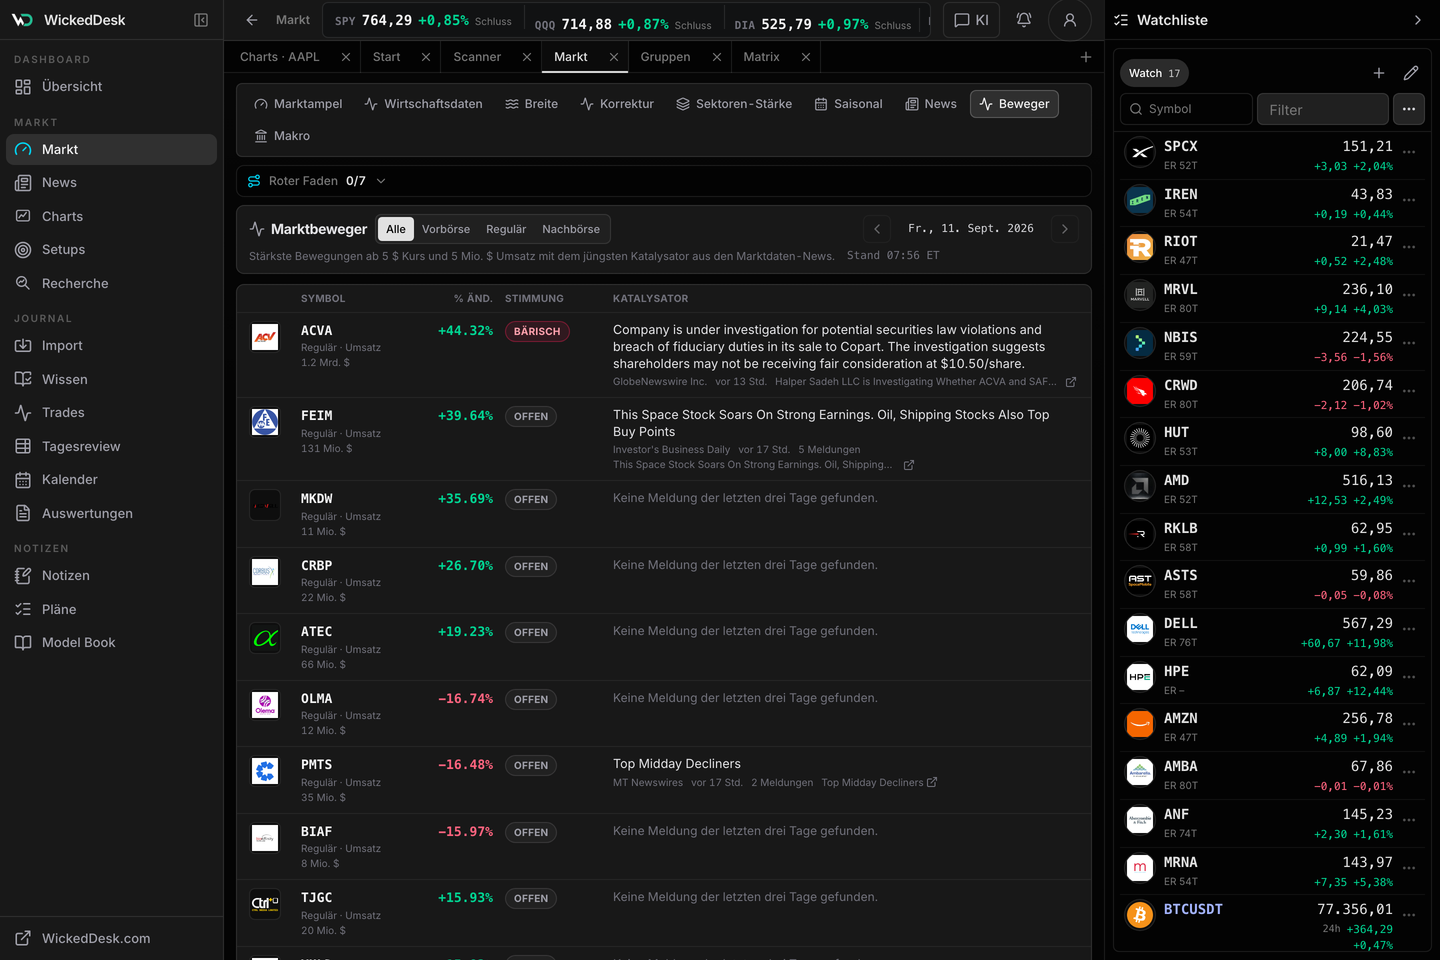
Events, news, catalysts, and earnings sit next to the chart so you can understand what moved the stock.
Related stocks, sector, industry, and group strength show whether the name has backing or trades alone.
Every stock you find becomes a concrete review: setup, risk, and an alert on the price that triggers the decision.


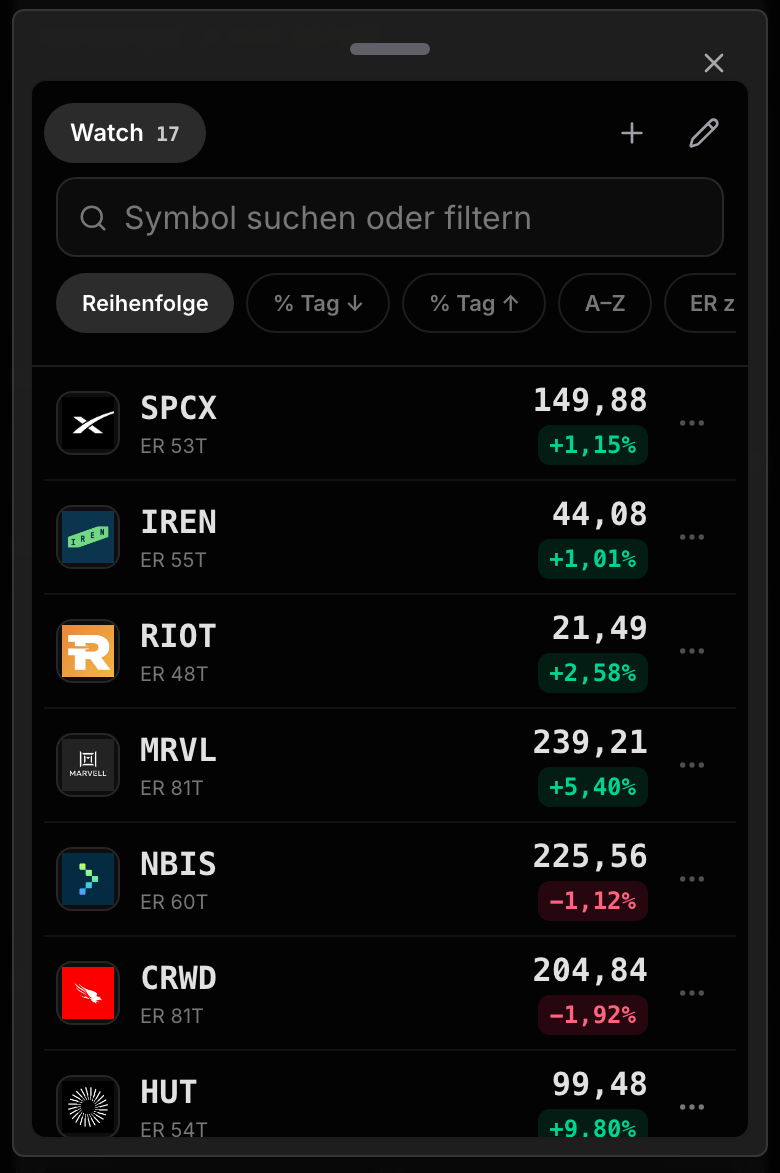
Choose the mode in settings. Simple shows fewer menus and clearer decisions. Pro shows the full app.
The mode only changes the view. Scanner, Atlas, watchlist, and journal stay in place.
Home, scanner, and Atlas show only what you need to check next.
Matrix, all scanners, full Atlas detail, journal, reports, and settings remain there.
Switch any time from settings.


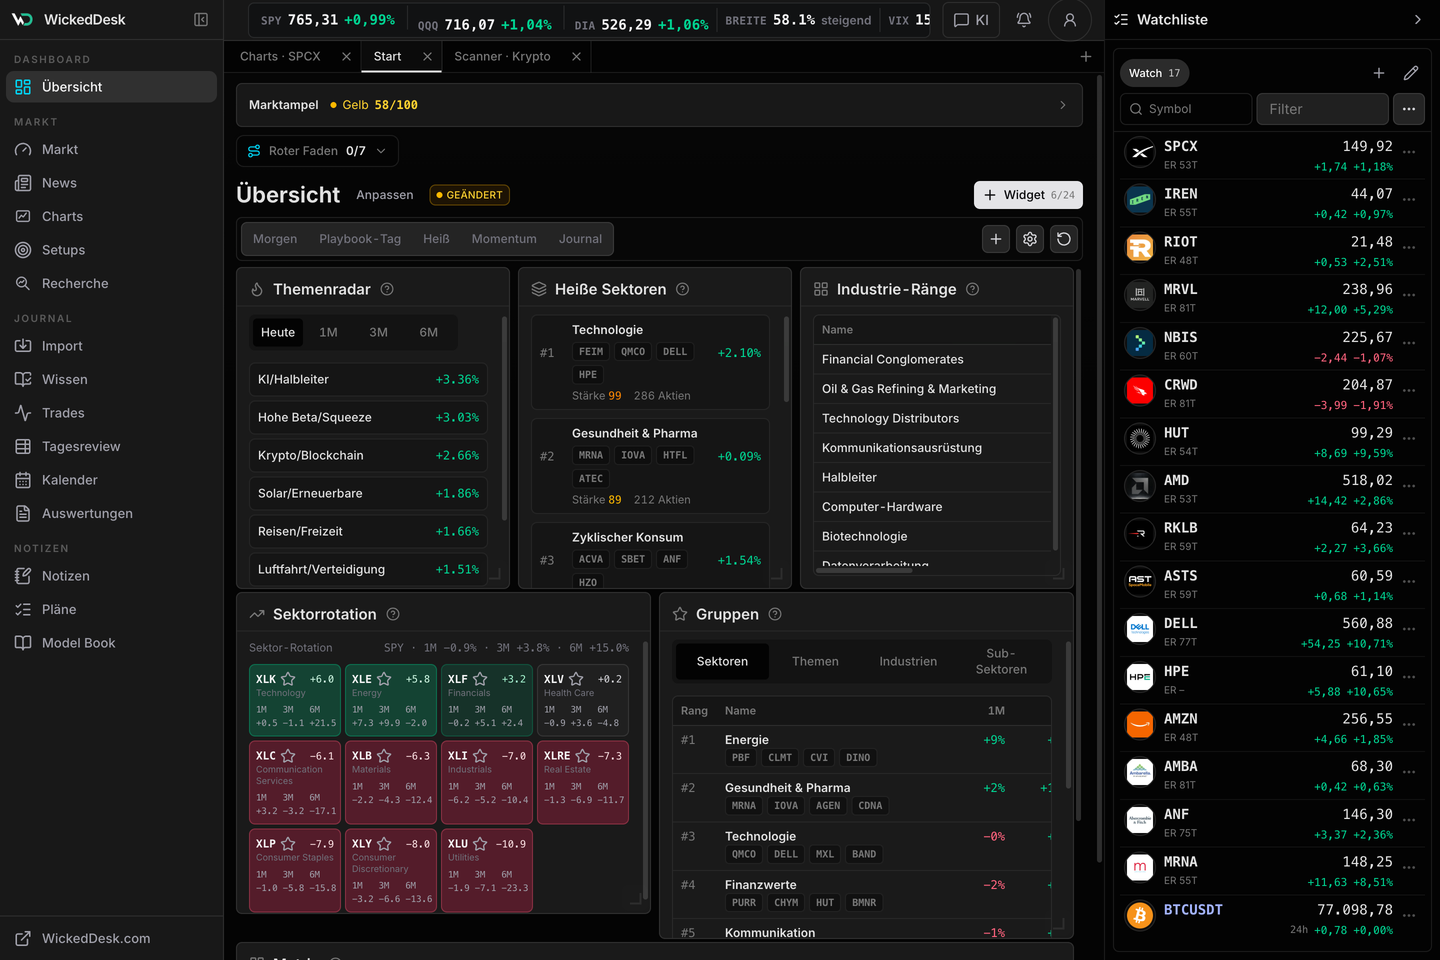
Templates like Hot, Momentum, and Journal plus custom profiles and widgets for weekly planning, research, or review.
Leaders, EPs, breakouts, pullbacks, and momentum ranked by RS, volume, ADR/ATR, catalyst, and group context.
Proprietary chart engine, earnings, news, catalysts, related stocks, and group context in one workspace.


Sectors, industries, themes, high proximity, ATH proximity, leaders, and best/worst rotation at a glance.
Themes become supply chains, bottlenecks, leaders, candidates, triggers, and risks.
Interactive Brokers import, manual import, AI import, review metrics, and professional PDF reports.
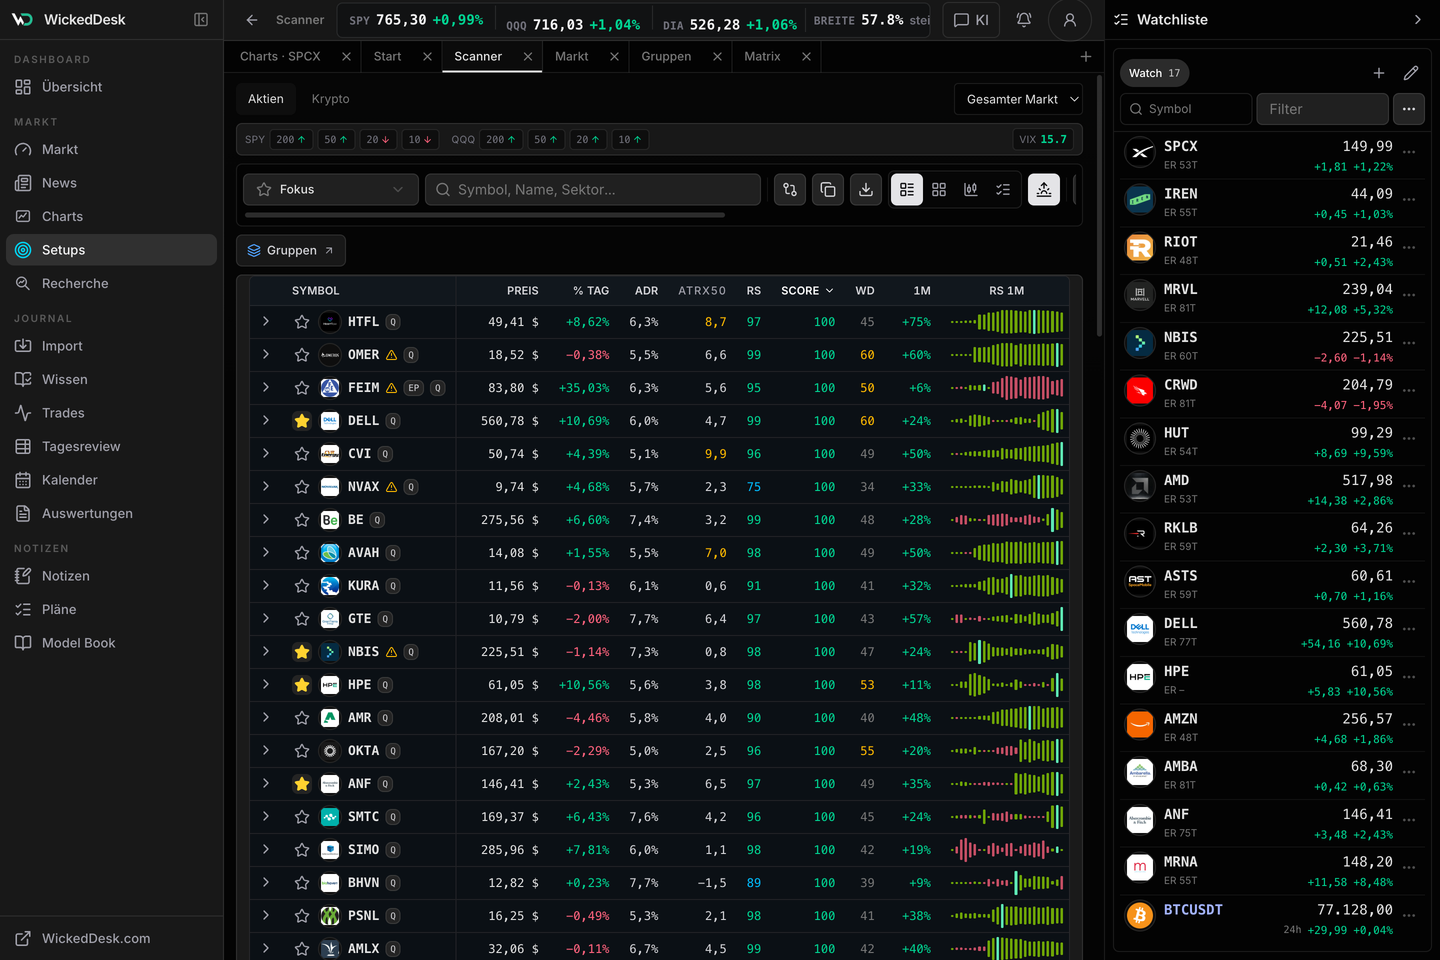
The scanner sorts before you read. At the top sits whatever brings relative strength, volume and group context at the same time, further down whatever is merely moving. What you end up with is a worklist for the next few days, not a hit list.
Surfaces strong stocks near new highs where relative strength, volume, liquidity, and structure line up.
Highlights re-ratings, gaps, earnings, episodic pivots, and volume surges before they disappear into loose watchlists.
Checks breakouts, pullbacks, and momentum bursts against ADR/ATR, market phase, group strength, and risk.
Connects candidates to Atlas, news, earnings, related stocks, and journal context so scan hits become preparation.
Dashboard, group rotation, scanner, and matrix find candidates. Atlas checks whether trend, events, group context, and risk line up for the ticker. The Builder structures themes. Journal and reports show whether the process improves.


Start from Morning, Hot, Momentum, or Journal and turn it into your own cockpit.


Sectors, industries, themes, leaders, and breadth in one heat view.


Ranks leaders, EPs, breakouts, pullbacks, and momentum by setup quality, RS, volume, ADR/ATR, 52-week proximity, catalyst, and group context.


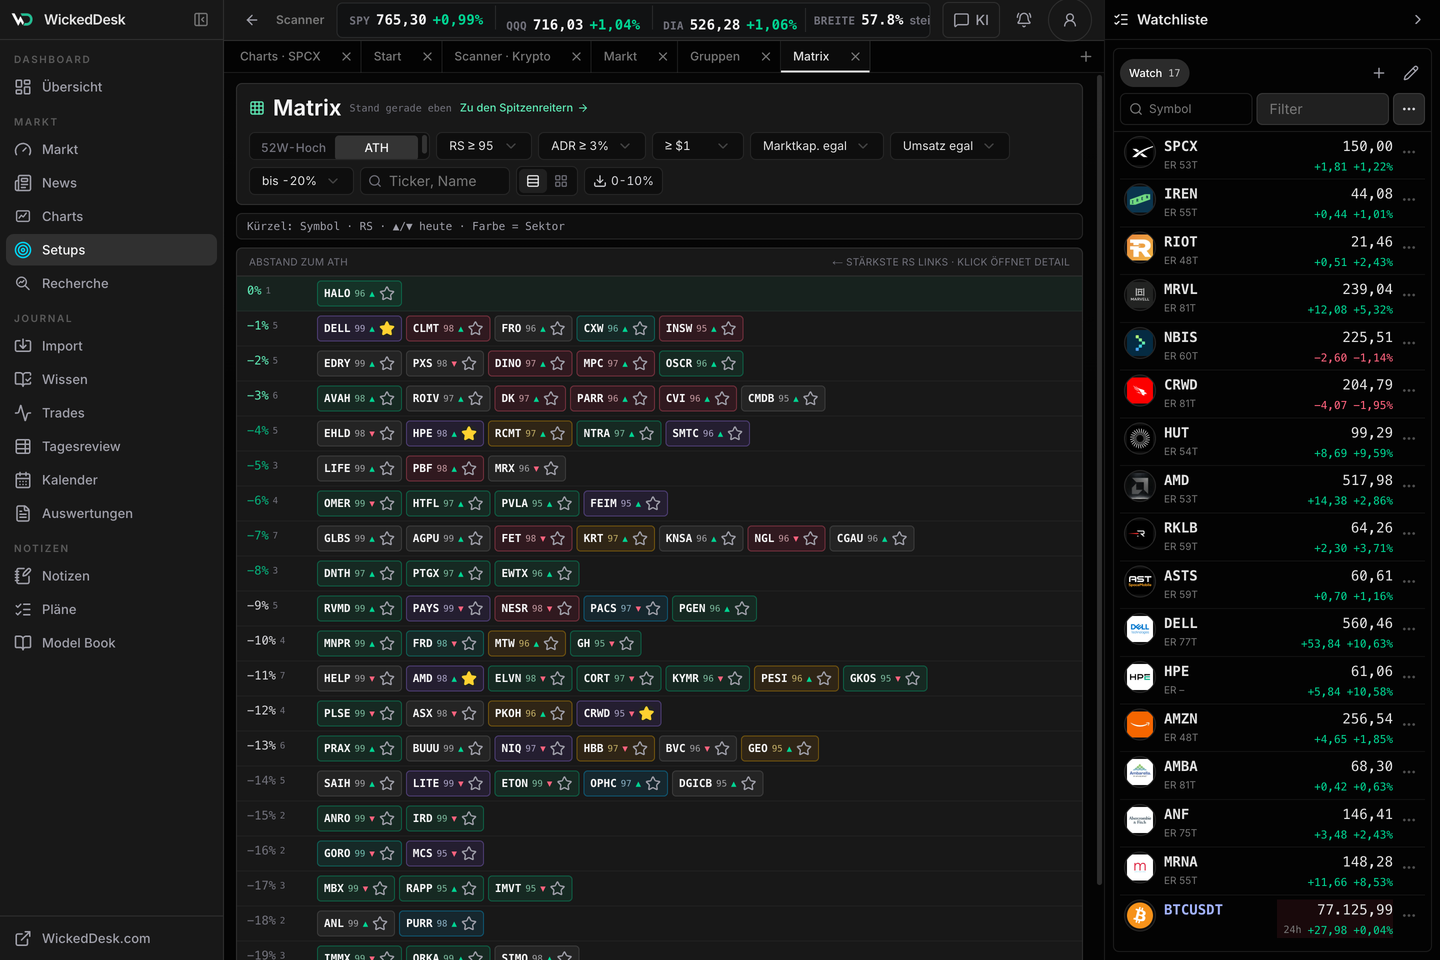
Shows stocks as proximity ladders to 52-week highs or all-time highs, filtered by RS, ADR, price, market cap, and dollar volume.


Turns a theme into a movable diagram with companies, chains, bottlenecks, risks, and follow-up questions.


Interactive Brokers, generic CSVs, manual trades, and AI import for documents, PDFs, or screenshots flow into a reviewable journal.
WickedDesk is not a signal service and not an order terminal. It is the workspace for the hours in which you decide what you will touch over the next few days.
Dashboard, scanner, Atlas, group rotation, Builder, journal, reports, and PDF export in one clear workspace. Every new account starts with 3 days of full access, no credit card.
The complete WickedDesk workspace for dashboard, scanner, Atlas, Builder, journal, and reports.
Answers to the questions we hear most often, from data sources to broker imports.
Yes. Every new account automatically starts with 3 days of full access, no credit card. After that you pick the monthly or annual plan.
wickeddesk focuses on US stocks (NASDAQ, NYSE, AMEX). Currently around 6,000 symbols including penny stocks, with fundamentals and setup classification.
During US market hours, wickeddesk refreshes available market data about every 60 seconds. Scanner setups, heat map, and breadth are then recalculated every 1-5 minutes depending on load and cache state.
Yes. Interactive Brokers reports and generic CSVs are processed directly. Manual import and AI import for documents, statements, PDFs, screenshots, or images are also part of the workflow.
Trades, notes, reports, and settings stay in your isolated workspace. No resale or sharing with third parties.
No. The plan is monthly and includes the full wickeddesk workspace.
No. The tool is broker-independent. It is an analysis and journal tool, not an order-entry system.
wickeddesk is not a realtime terminal for order execution. Quotes can be delayed depending on exchange and data feed; once new data is available, it usually appears in the app within the next 60-second refresh.
Yes. Atlas, scanner, and journal are responsive. The iOS app has been submitted to Apple and is awaiting approval. Until then, the web app runs directly in Safari/Chrome on iOS and Android.
The scanner ranks candidates by setup, volume, RS, and context. Atlas is the review desk afterwards: chart, movement drivers, earnings, news, related stocks and group strength in one place, plus the alert on the price that matters.
Dashboard, scanner, Atlas, Builder, journal and reports in one workspace, from the market picture to the review. No credit card, cancel at period end.