Use WickedDesk every day
A fixed order for preparation: market, groups, watchlist, chart, and plan.
Trading is complicated enough. WickedDesk should not be another screen to click through. It gives you an order.
Start with the market, review the strongest groups, build a short watchlist from scanner and matrix, and open the chart only after that. The first ticker does not decide your day.

Start with the market picture
Check market signal, breadth, indexes, and the most important news first. The goal is not to find a stock immediately. The goal is to know whether the market supports new ideas.
When breadth, indexes, and news diverge, keep the watchlist shorter. In stronger phases, you can search more broadly. In yellow or red phases, demand more confirmation.

Read groups before single stocks
Next come sectors, themes, and industries. Strong stocks often do not stand alone. If a stock looks strong but its group does not confirm, it stays on observation.
The group view shows where momentum, breadth, and relative strength line up. Compare today, one week, one month, three months, and six months to see whether a move is starting or only interrupting a weak period.

Review scanner hits
The scanner shows stocks with strength, volume, proximity to highs, or a setup. A hit is not a setup. It is a name for the next check.
Choose the right scanner: leaders, EP, breakout, pullback, tight range, or ADR. Then check RS, volume, proximity to highs, ADR/ATR, catalyst, and group context. For long setups, keep one rule fixed: price above the SMA 200. In WickedDesk, the red line in the chart is the SMA 200 by default.
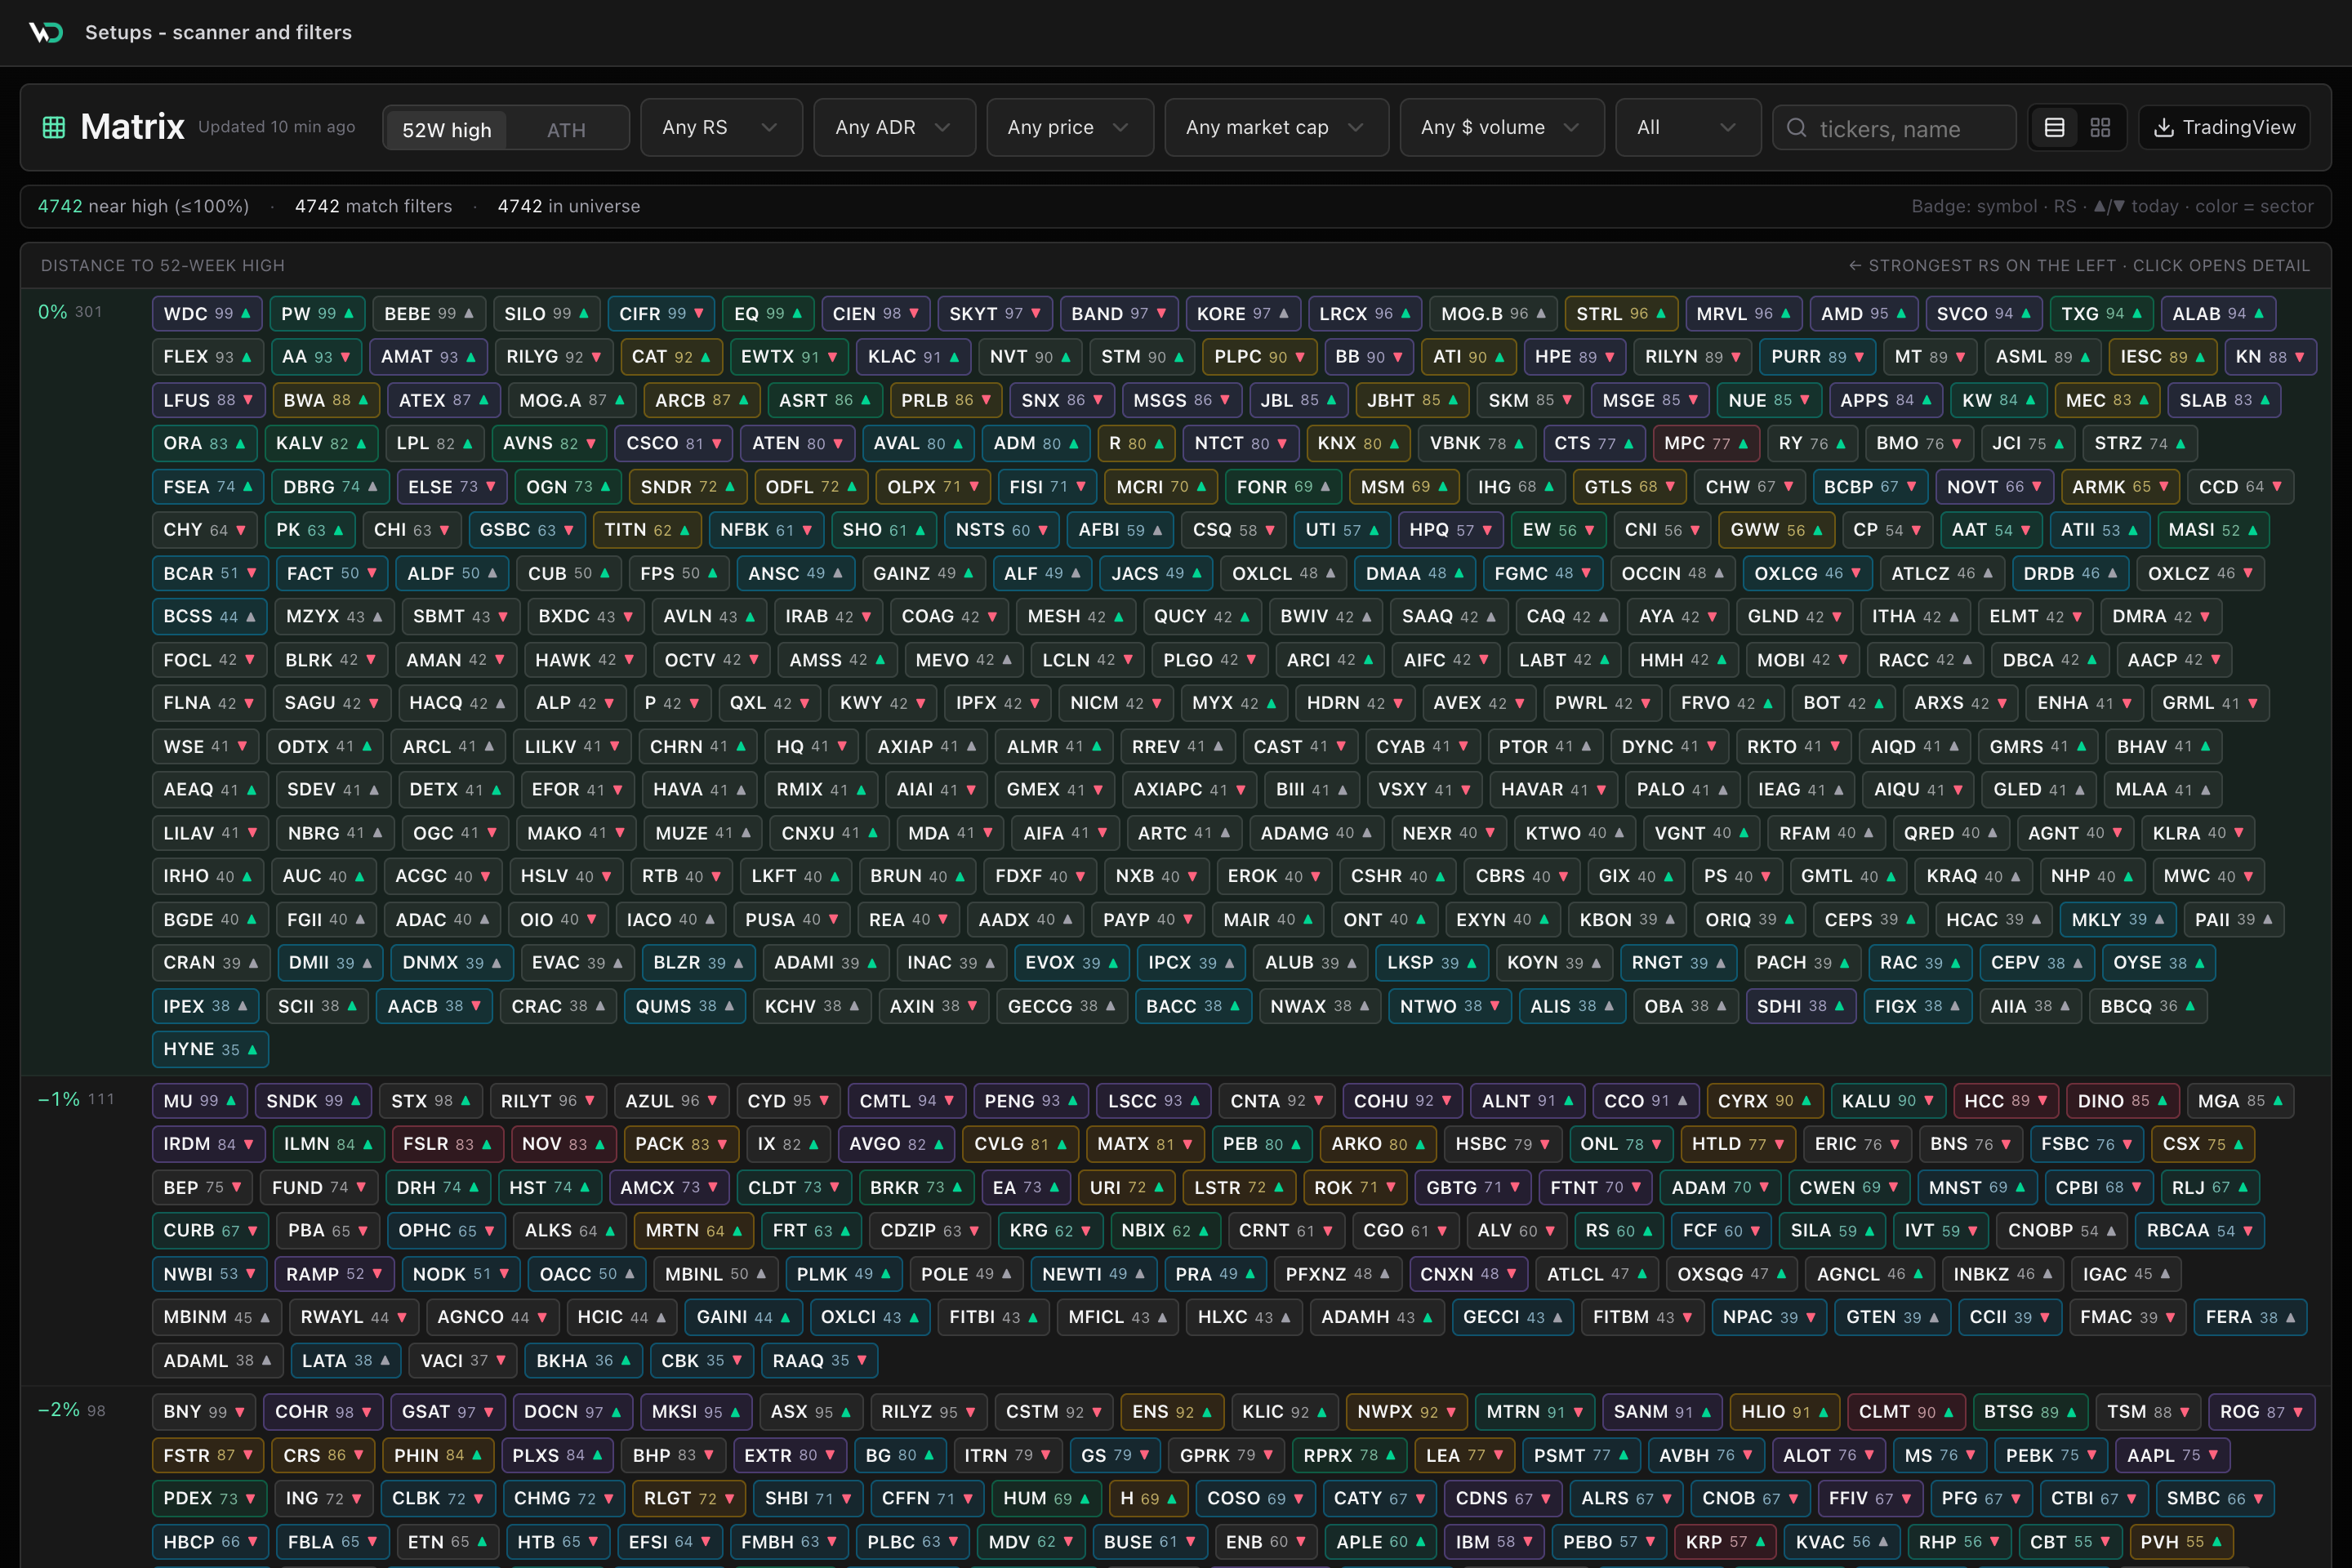
Use matrix for proximity to highs
The matrix shows stocks near 52-week highs or all-time highs. Many strong setups start from strength pausing, not from deep weakness.
Use filters for RS, ADR, price, market cap, and dollar volume. What remains should be names you actually want to check in the chart.

Check chart, sidecar, and checklist together
The chart is where a watchlist name becomes a plan or gets removed. Price, volume, next earnings, news, events, related stocks, group context, and checklist stay together.
For earnings, do not stop at the reported result. Compare EPS and sales with the prior estimate and read the surprise. The goal is not to draw more lines. You want to see entry, stop, risk, and invalidation.
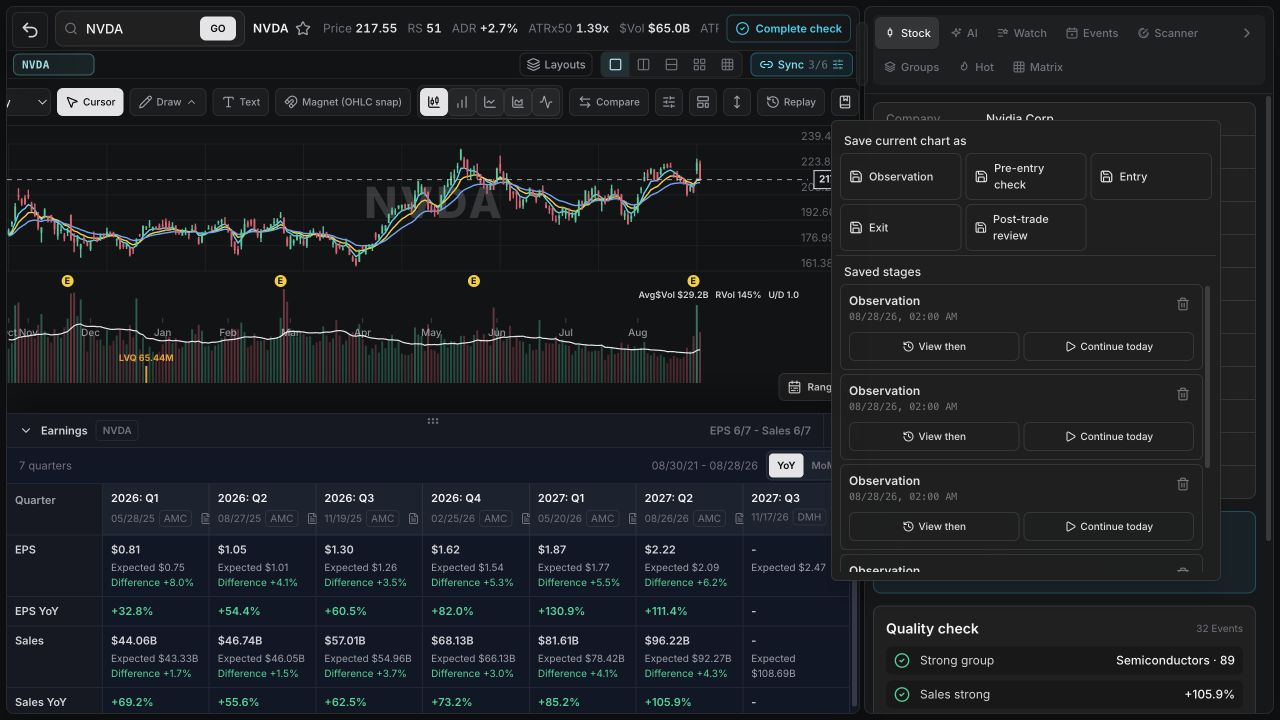
Save chart states as a history
Save the first observation, pre-entry check, entry, exit, and post-trade review as stages of the same idea. Timeframe, visible range, indicators, and drawings remain available.
View then opens the saved chart. Continue today applies its settings to current price data. The full workflow is covered in the guide to chart history, Model Book, and journal.

Keep the watchlist short
A good watchlist is short. If you need to re-check twenty names every evening, the watchlist is too wide.
Place alerts at the prices where the decision changes. Until then, the alert watches, not you.
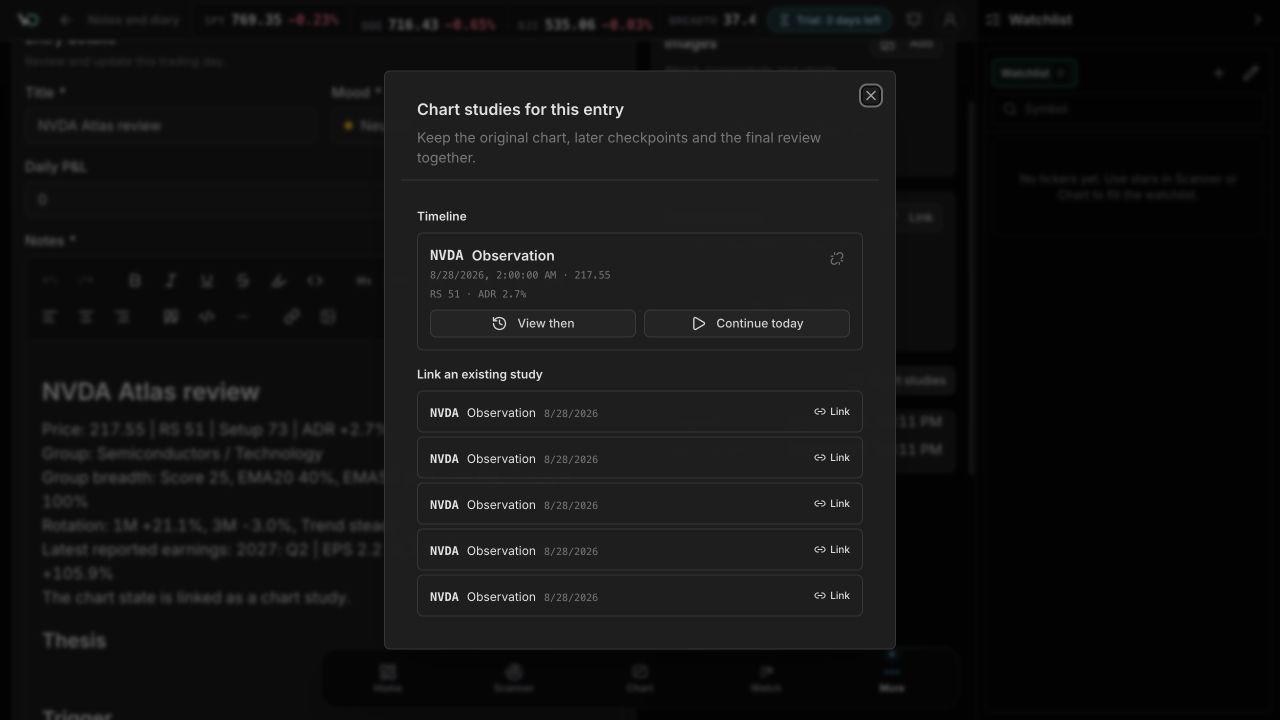
Tie the review back to preparation
After the trade, profit and loss are not enough. The real question is whether the entry matched your preparation.
Journal and reports show which setups, hours, symbols, and mistakes repeat. The linked chart history also shows what you had seen and drawn when you made the decision.
Workflow
Check the market picture
Read signal, breadth, indexes, and news.
Rank groups
Read sectors, themes, and industries by strength.
Tighten the watchlist
Reduce scanner and matrix to a few checkable names.
Control the chart
Combine trend, volume, events, group context, and risk.
Write the plan
Capture watchlist, alert, entry, stop, and invalidation.
Review the trade
Afterward, check whether the process worked.